

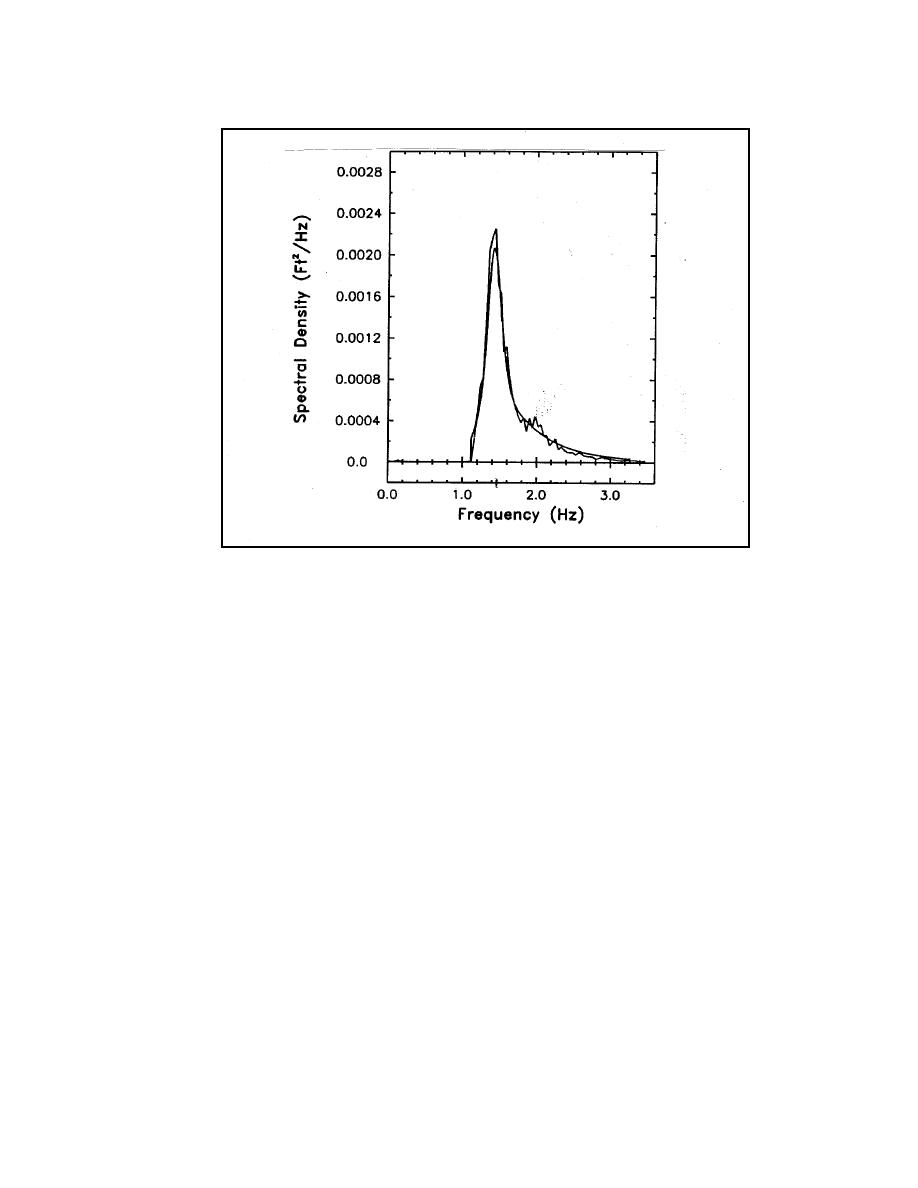
Figure 13. Comparison of targeted and measured spectra for wave generation
Data Analysis
The velocity data were analyzed to determine wave direction with a program
adapted from a PUV (pressure and horizontal velocity components) directional
wave gauge analysis program as outlined by Earle, McGehee, and Tubman
(1995). Because water level variation was unavailable at the location of the
current meter probe, the wave direction and energy for each frequency were
determined from the harmonics of the directional spectum related to velocity.
These harmonics are calculated from auto- and cross-spectra determined from a
Fast Fourier Transform (FFT) of the velocity records.
Wave data were analyzed in two ways. A down-crossing analysis was
performed on the time series of water elevations as well as spectral analysis using
an FFT. The down-crossing analysis produced the calculated parameters shown
in Table 3.
FFT or single-channel frequency domain analysis was performed over the
entire 20,400 data points (∆t = 0.05 sec). In the analysis, the mean was removed
and a cosine square taper applied over 10 percent of the data at the beginning and
end of the data record. The spectral parameters calculated are listed in Table 4.
19
Chapter 3 Measurement Procedures and Data Analysis


 Previous Page
