

Figure 5-9d.
Near-maximum ebb-tide velocity and depth, Mattituck Inlet, 1830
GMT, 7 October 2002
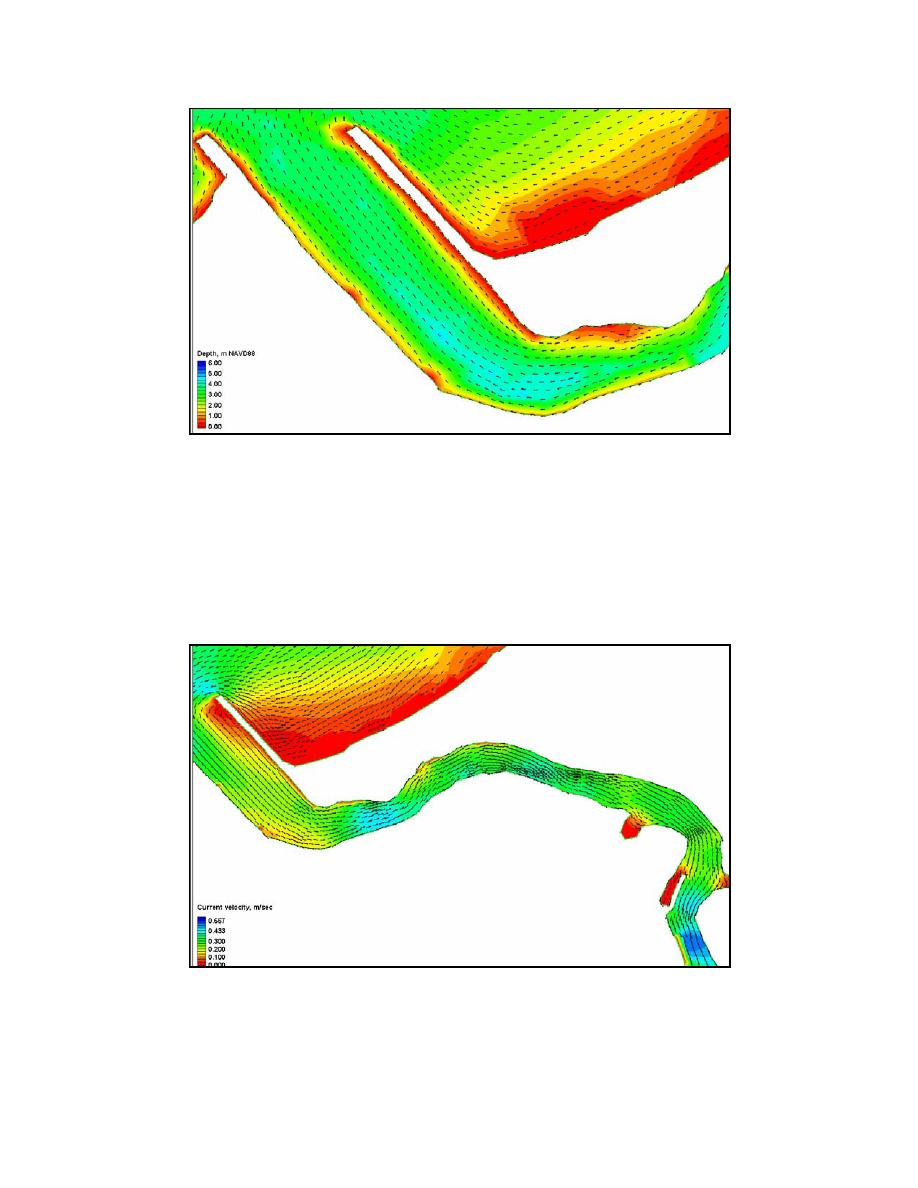
Figures 5-10a and 5-10c display near-maximum flood- and ebb-tide current
velocities within Mattituck Inlet and the northern portion of Mattituck Creek.
Figures 5-10b and 5-10d display these velocity vectors overlying the bathymetry
of these areas. Current magnitude exceeds 0.5 m/sec in the creek in narrow
areas.
Figure 5-10a. Near-maximum flood-tide velocity, Mattituck Inlet flood shoal area,
1200 GMT, 7 October 2002
220
Chapter 5 Circulation Analysis


 Previous Page
