

*
Thus, the initially calculated transport rate Q6 must be adjusted to Q6 (Fig. 1b) to
cause the shoreline to advance up to the detached breakwater but no further,
*
*
giving y6 = yt . With the new transport Q6 now going out of Cell 5, the shoreline
*
location in this cell will be adjusted from y5 to y5 . In this particular case, only
two cells were recalculated. In the general case, the correction may be carried
through any number of cells until the criterion that the shoreline may not advance
beyond the DBW is not violated.
APPLICATIONS
Comparison with Physical Model T-head Groin Tests. Field data describing
salient or tombolo development inside of T-head groins of detached breakwaters
are rare. Available filed case studies typically give the near-equilibrium shoreline
configuration but not the temporal coastal evolution or the associated wave time
series. Thus, as a substitute, results from a movable-bed physical model were
examined. In a previous study, Hanson and Kraus (1991) compared predictions
of the GENESIS model, with results obtain in a physical model (Hashimoto et al.
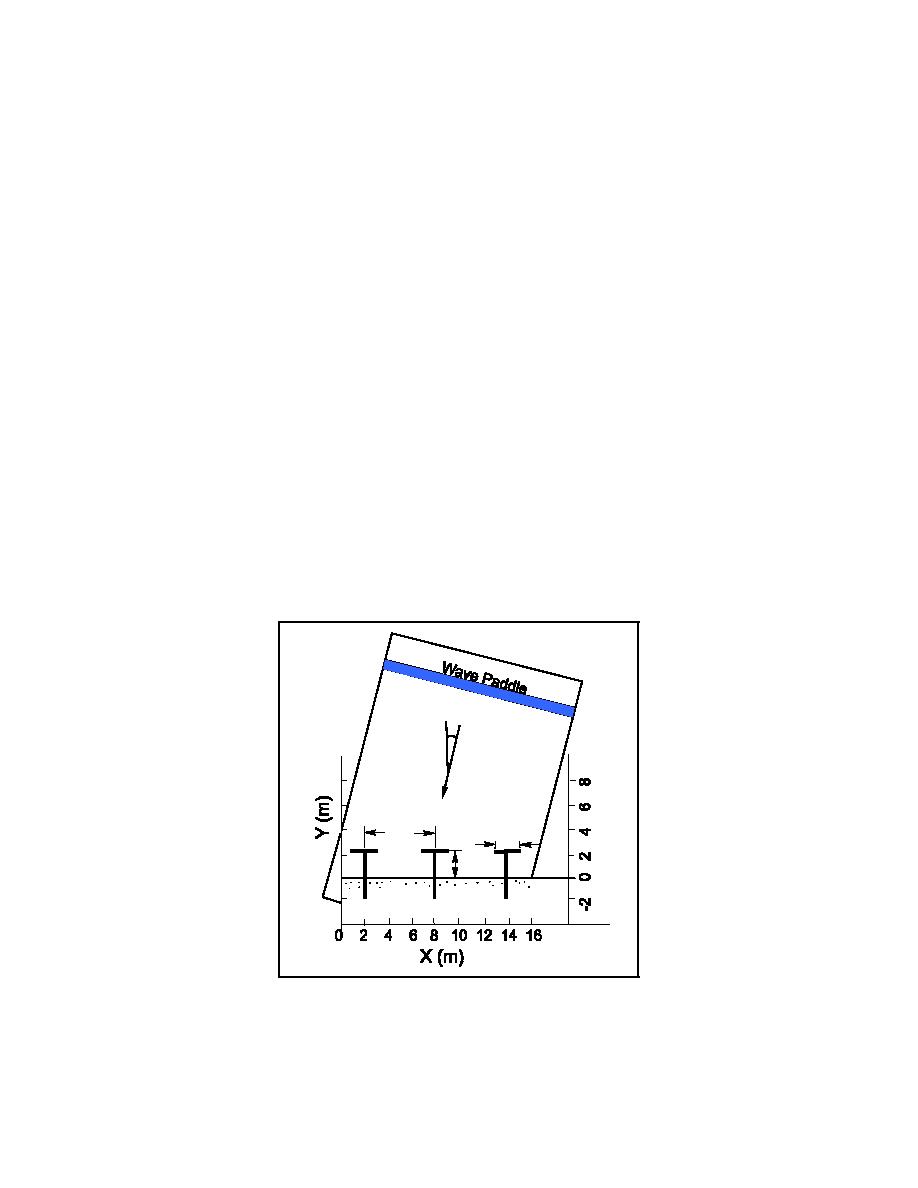
1981). Hashimoto et al. evaluated four shore-protection designs for winter wave
conditions at a site facing the Pacific Ocean of Japan by using a large wave basin
(16 by 20 m) and a sand bottom. The structure dimensions and spacing were
modeled at 1/50 scale. The basin configuration is shown in Fig. 2.
14 deg
6m
1.2 m
1.8 m
Initial
Shoreline
Fig. 2. Configuration of physical model of Hashimoto et al. (1981).
3
 Previous Page
