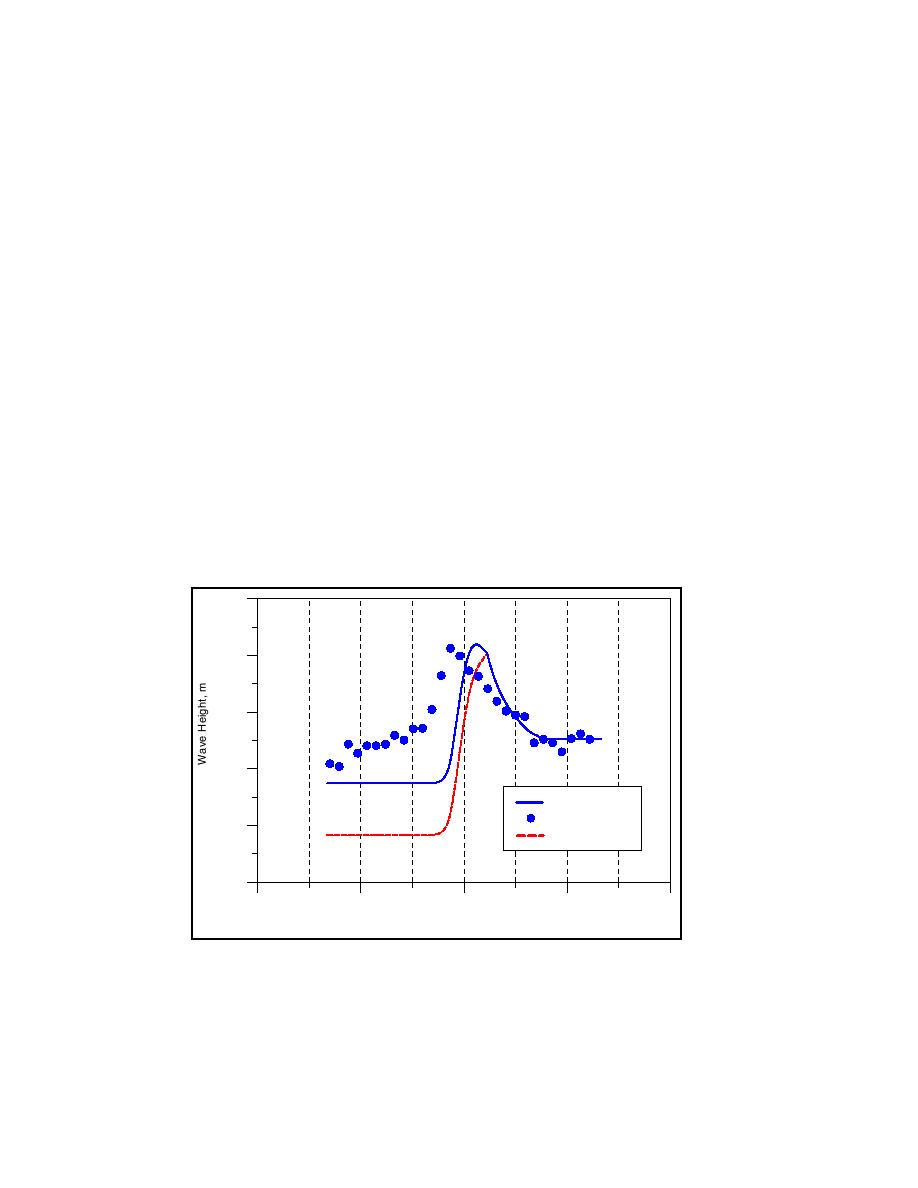
To investigate the consequence of changing the coefficient Γ in the
expression describing the stable wave height, and to determine if this would
yield better agreement with the data, simulations were performed for a range
of Γ-values. As an example, Figure 12 displays the result of increasing Γ,
which produces a larger stable wave height and better agreement with the
measurements. The smoother evolution of the wave height just after
breaking for Γ = 0.6 is a result of the balance between shoaling due to the
increase in current speed and wave energy dissipation due to breaking. Thus,
the point of incipient breaking is the same for the two simulations shown in
Figure 12. However, the shoaling overpowers the dissipation initially,
producing a wave height increase instead of decrease even after breaking
starts. By modifying the value of Γ acceptable agreement is obtained for the
stable wave height, but the wave height decay in the more shoreward portion
of the breaking wave zone is overestimated.
Representative tests similar to those selected from the monochromatic
wave experiments were simulated for the random wave tests (see Table 3 for
the wave conditions). A Monte-Carlo simulation was employed, assuming a
Rayleigh pdf for the wave height at the input point of the waves and the
period was held constant and equal to the peak spectral period. This
description oversimplified the statistical properties of the incident wave field,
especially in realizing that wave period is a decisive parameter for estimating
blocking. Chawla and Kirby (2002) pointed out that, in their experiments,
some waves were blocked coming off the wave paddle because of their short
period.
0.24
0.20
0.16
0.12
Calc. with 0.6
Measured
0.08
Calc. with 0.4
0.04
-8
-4
0
4
8
Distance Across Shore, m
Figure 12. Calculated and measured wave height for Chawla and Kirby
(1999), Test M18
34
Chapter 4 Verification of Wave Model


 Previous Page
