Home
Download PDF
Order CD-ROM
Order in Print
Home
>
Costal Inlets Research Program
>
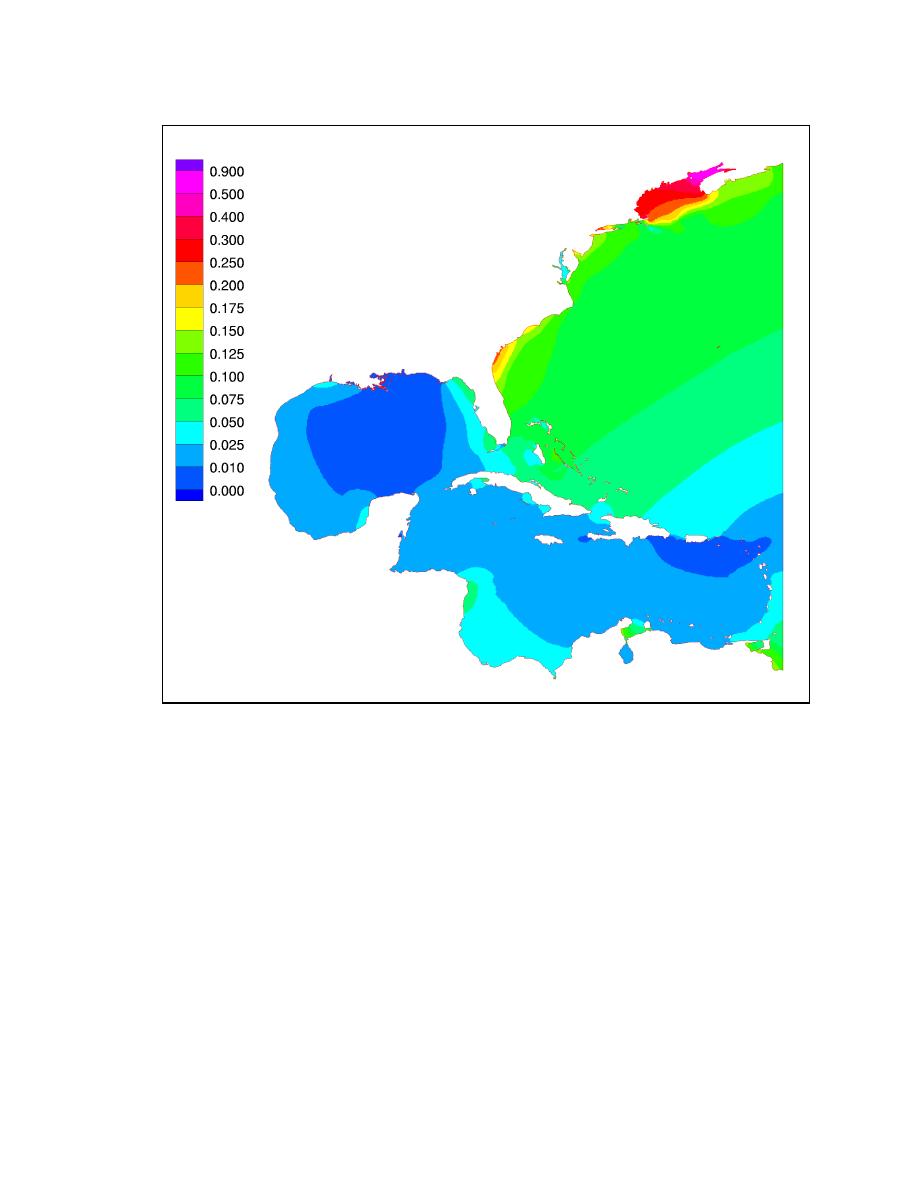
> Figure 28. N2 coamplitude chart (in meters)
Figure 27. S2 phase cotidal chart (in degrees relative to GMT)
Figure 29. N2 phase cotidal chart (in degrees relative to GMT)
TR-02-24
Page Navigation
49
50
51
52
53
54
55
56
57
58
59
Figure
28.
N
2
coamplitude
chart
(in
meters)


 Previous Page
