

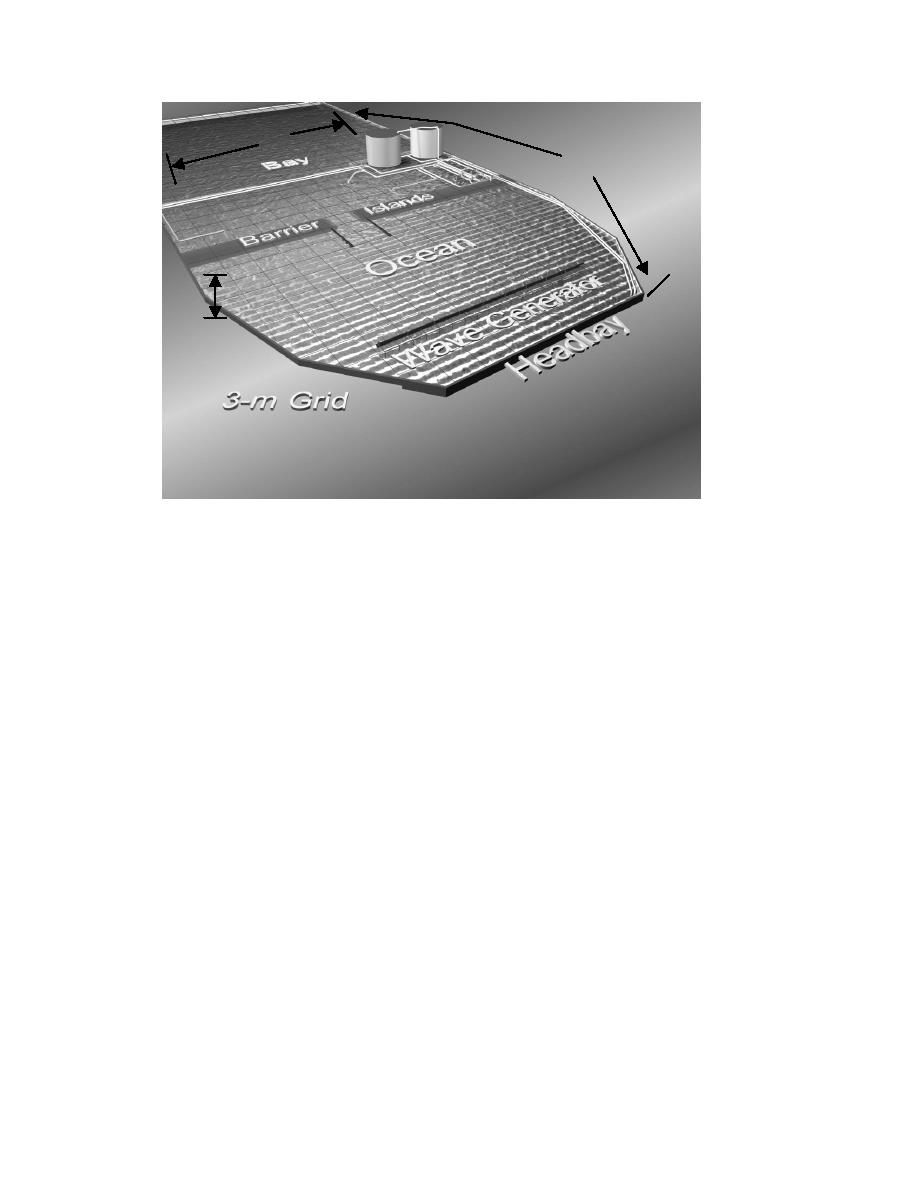
46 m
99 m
0.61 m
Figure 2. Idealized inlet model research facility
that may be adjusted for one, two, or three bay channels or a uniform flow across
the bay. Water is either released (flood flow) or taken from (ebb flow) the ocean
headbay to complete the circulation energized by the pumps located in the upper
right side of Figure 2.
Figure 3 shows bottom contours at a 1:50 scale. The ocean-side parallel
contours were specified by applying an equilibrium profile equation from Dean
(1977):
d = Ax0.67
(1)
where
d =
still-water depth
x = distance offshore
and A is determined by sediment characteristics. A value of A = 0.24 ft1/3 was
specified to represent a relatively steep beach. The contoured beach slope
extends to the 18.3-cm (0.6-ft) mean low water (mlw) depth (or 9.1 m (30 ft)
scaled by 1:50).
The inlet throat region converges to a depth of 15.2 cm (or if scaled to 1:50,
to a depth of 7.6 m (25 ft)) relative to an mlw datum. The minimum width is
267 cm (8.76 ft) (or if scaled by 1:50, 133.4 m (438 ft)) across the inlet between
mlw contours. Figure 4 shows the inlet with a parallel jetty configuration.
6
Chapter 2 Laboratory Facility, Equipment, and Experiment Design

 Previous Page
