

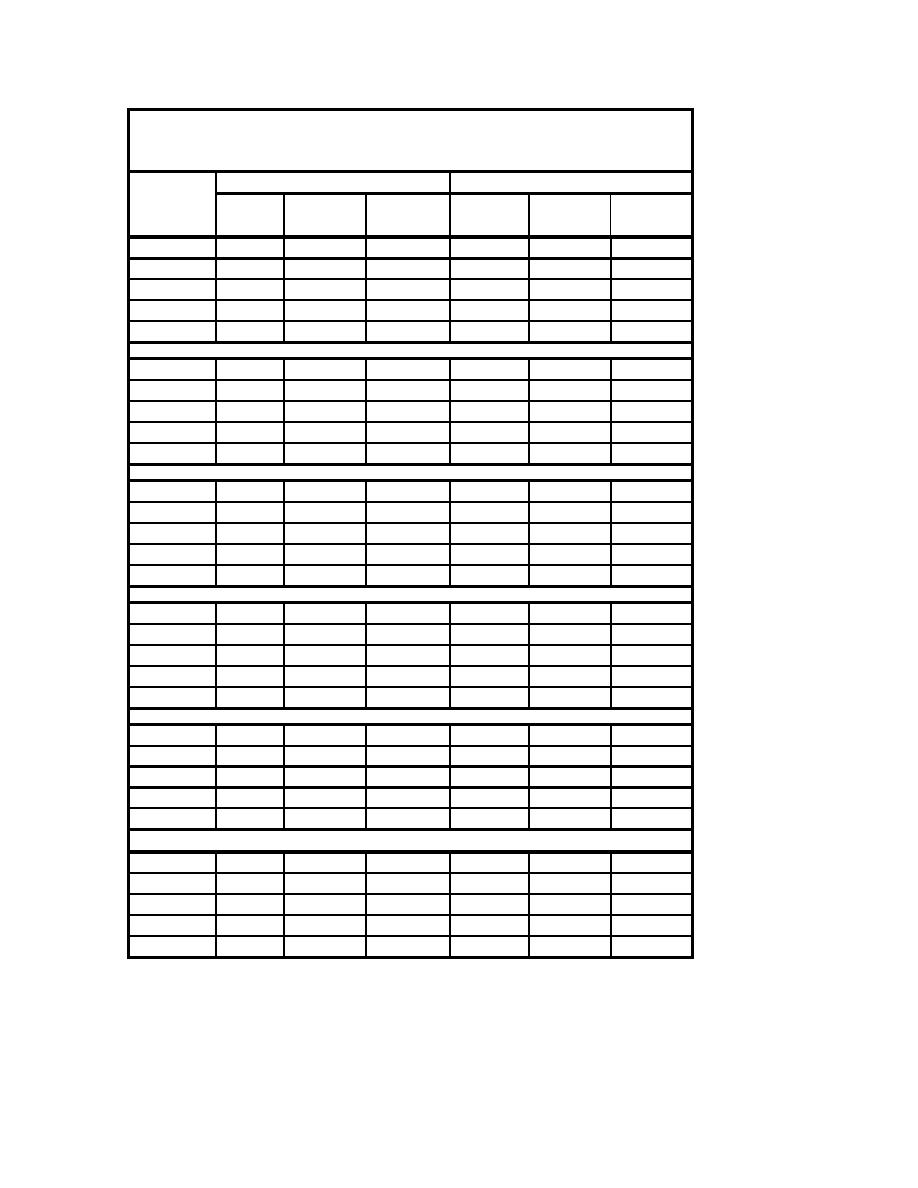
Table C1
Summary ADV Probe Vector Plot Data
Structure 1
ADV Probe 0
ADV Probe 1
Peak
Peak
Peak Energy
Peak
Peak
Peak Energy
Gauge
Direction
Period
Density
Direction
Period
Density
Arrangement
2
2
ft /Hz
deg
sec
ft /Hz
deg
sec
g1x1 NO DATA
g2x1
0.985
0.0038
252.00
0.985
0.0162
229.10
g3x1
0.853
0.0132
245.34
0.853
0.1811
212.78
g4x1
0.985
0.1250
230.25
0.914
0.6038
203.77
g5x1
0.800
0.0289
242.050
0.800
0.1797
210.86
g1x2 NO DATA
g2x2
2.559
0.0037
269.89
1.829
0.0595
226.75
g3x2
2.133
0.0047
261.56
2.133
0.0266
219.08
g4x2
2.600
0.0217
255.30
2.560
0.0361
204.06
g5x2
2.560
0.0023
264.77
2.133
0.0369
218.21
g1x3
0.914
0.0002
261.46
0.948
0.0002
255.20
g2x3
0.985
0.0002
263.13
0.914
0.0028
220.13
g3x3
0.948
0.0006
255.74
0.883
0.0046
224.10
g4x3
0.985
0.0042
240.73
0.853
0.0643
199.75
g5x3
0.914
0.0084
256.41
0.853
0.0461
199.51
g1x4
0.985
0.0074
253.52
0.985
0.0221
236.10
g2x4
0.914
0.0175
249.01
0.914
0.0362
238.57
g3x4
0.800
0.0789
240.84
0.800
0.5159
218.42
g4x4
0.853
1.1224
218.36
0.800
2.2828
207.86
g5x4
0.800
0.2194
231.08
0.985
0.6914
214.42
g1x5
2.560
0.0117
251.75
2.560
0.0123
234.72
g2x5
2.560
0.0104
255.64
1.829
0.0994
226.79
g3x5
2.560
0.0202
240.68
1.829
0.6386
216.19
g4x5
1.829
0.6549
217.85
2.560
0.2355
203.34
g5x5
2.560
0.0356
225.67
1.829
1.2113
208.51
g1x6
0.914
0.0011
269.36
0.800
0.1757
254.69
g2x6
0.914
0.0015
258.28
0.853
0.0423
220.43
g3x6
0.985
0.0097
239.58
0.914
0.0628
220.50
g4x6
0.914
0.1165
208.94
0.914
0.4129
205.61
g5x6
0.914
0.0316
231.70
0.985
0.0898
208.31
C8
Appendix C Wave Diffraction-Refraction Plots for Structure 1

 Previous Page
