

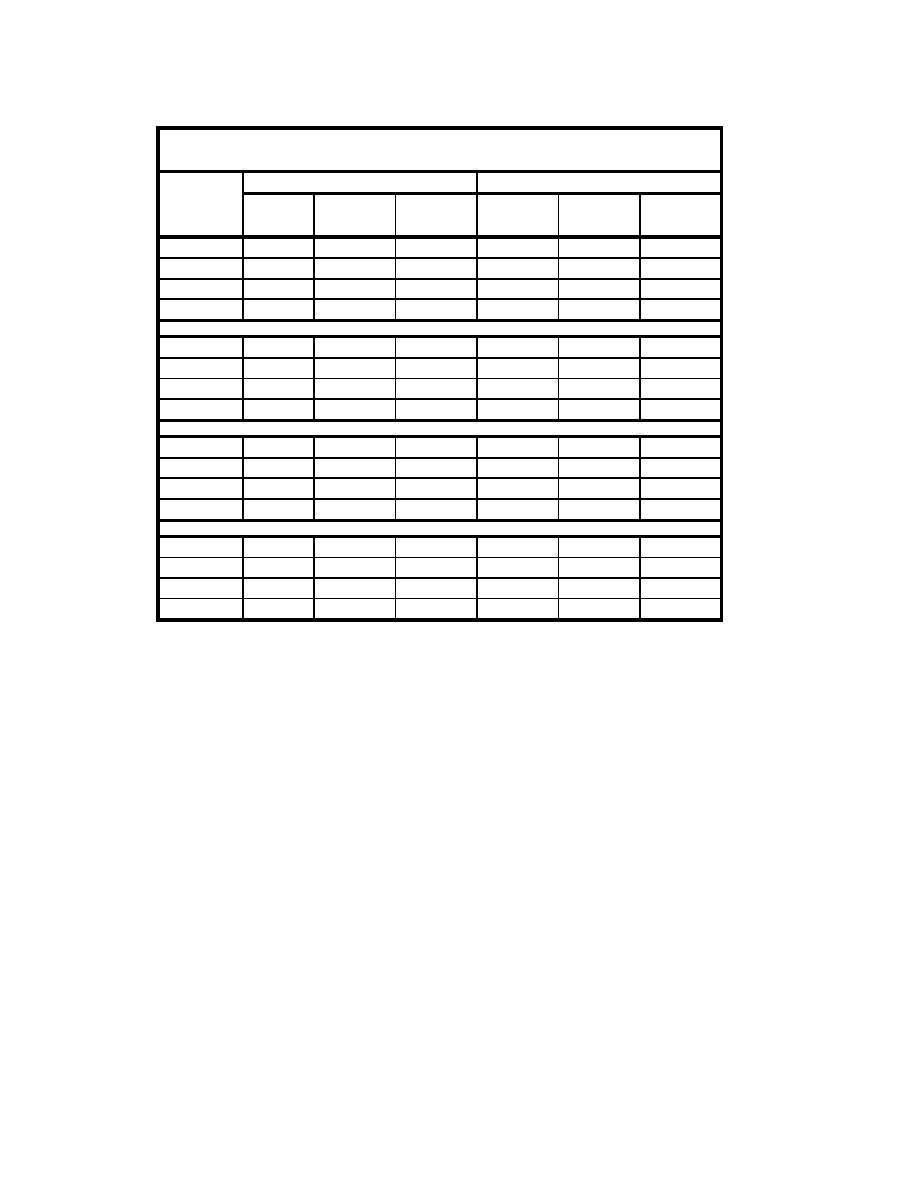
Table I1
Structure 4 ADV Probe Vector Plot Data
ADV Probe 0
ADV Probe 1
Peak
Peak
Peak Energy
Peak
Peak
Peak Energy
Gauge
Direction
Period
Density
Direction
Period
Density
Arrangement
2
2
ft /Hz
deg
sec
ft /Hz
deg
sec
g1x1
0.098
0.033
229.46
0.098
0.014
210.82
g2x1
0.985
0.033
240.53
0.985
0.072
217.52
g3x1
0.853
0.000
186.30
0.985
0.000
359.76
g4x1
0.985
0.014
266.68
0.853
0.044
207.85
g1x2
1.600
0.099
234.30
1.829
0.026
204.09
g2x2
1.600
0.056
247.02
1.600
0.027
214.93
g3x2
2.560
0.082
256.93
2.560
0.045
218.89
g4x2
2.133
0.039
290.17
1.829
0.031
225.37
g1x3
0.800
0.667
227.82
0.800
0.149
202.62
g2x3
0.800
1.066
235.80
0.800
0.145
210.99
g3x3
0.800
0.746
245.10
0.853
0.005
208.24
g4x3
0.914
0.005
204.46
0.800
0.543
197.15
g1x2c
2.133
0.147
238.16
1.829
0.063
208.47
g2x2c
1.600
0.062
252.12
1.829
0.062
214.06
g3x2c
2.133
0.053
266.83
2.560
0.079
213.84
g4x2c
1.829
0.026
283.86
1.600
0.023
225.26
I6
Appendix I Wave Diffraction-Refraction Plots for Structure 4

 Previous Page
