Appendix P
ADV and CIIS Measurement
Comparison: Structure 1
This appendix presents plots and tables of normalized spectral energy density
collocated Coastal Inlets Imaging system (CIIS) and Accoustic Doppler
Velocimeter (ADV) measurements for Structure 1, Experiments 4 through 6. S(f)
is normalized by the maximum value of the variance spectrum for a given
experiment and sensor. Tick ("+") marks on wave direction curves represent
CIIS measurements that meet the coherence cutoff criterion discussed in
Chapter 5.
Plot and table titles include 6-digit strings that indicate structure (characters
1-2), experiment (characters 3-4), and gauge arrangement (characters 5-6). For
example, S1X4G1 represents Structure 1, Experiment 4, Gauge Arrangement 1.
The legend of each plot indicates ADV probe identification number and camera
identification number.
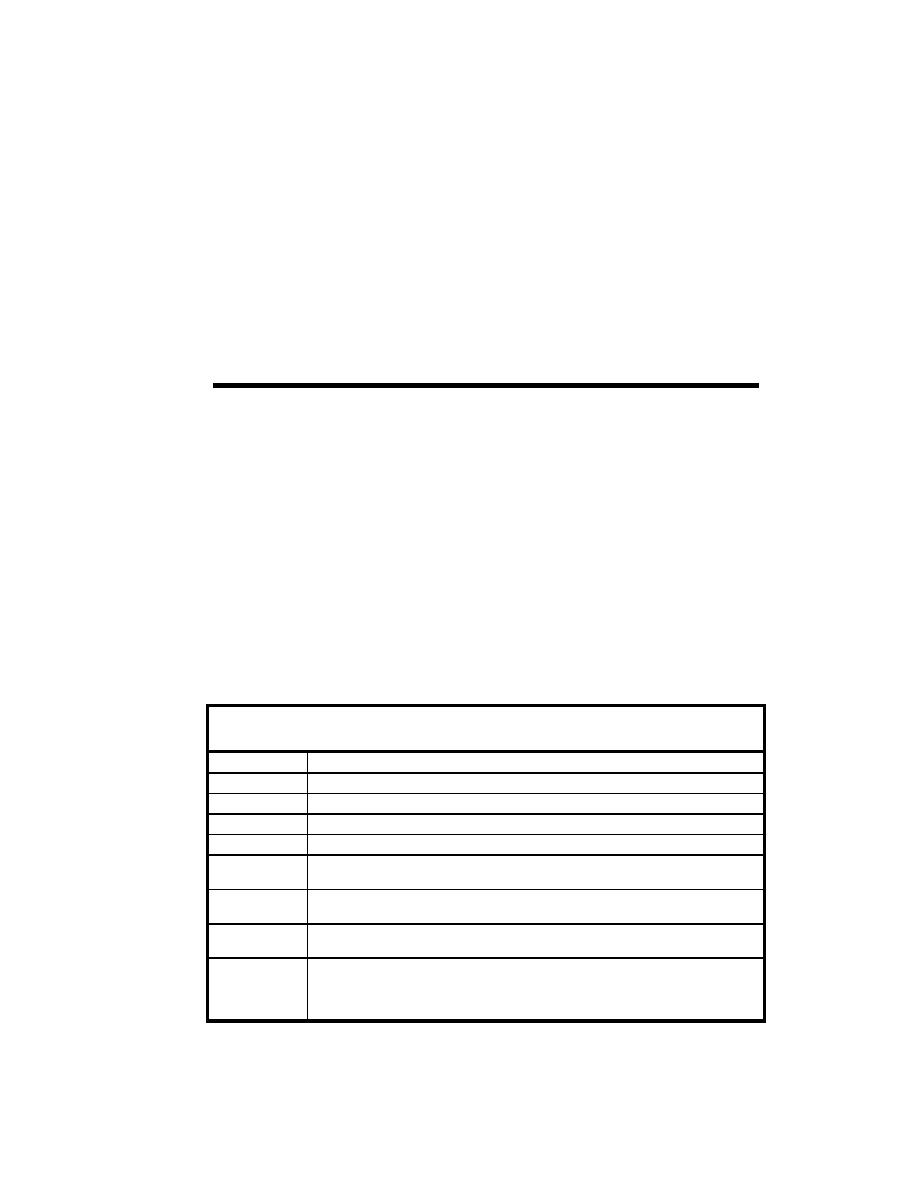
Table P1
Nomenclature
Alongshore
Y-axis of model coordinate system
Cross-shore
X-axis of model coordinate system
NaN
Not a number
Pixel intensity
I
Frequency (Hz)
f
2
S( f )
Mean spectral density as a function of frequency presented in units of m /Hz for
2
ADV and I /Hz for CIIS
S( f )n
Normalized mean spectral density as a function of frequency presented in units of
2
2
m /Hz for ADV and I /Hz for CIIS . Normalized by maximum S( f ).
θm( f )
Vector-mean wave direction as a function of frequency presented in units of deg
relative to model coordinate system
θm( f )C
Vector-mean wave direction as a function of frequency presented in units of deg
relative to model coordinate system following application of coherence cutoff
criteria. Values of not meeting the cutoff criterion are presented as NaN values
(i.e., not-a-number).
P1
Appendix P ADV and CIIS Measurement Comparison: Structure 1


 Previous Page
