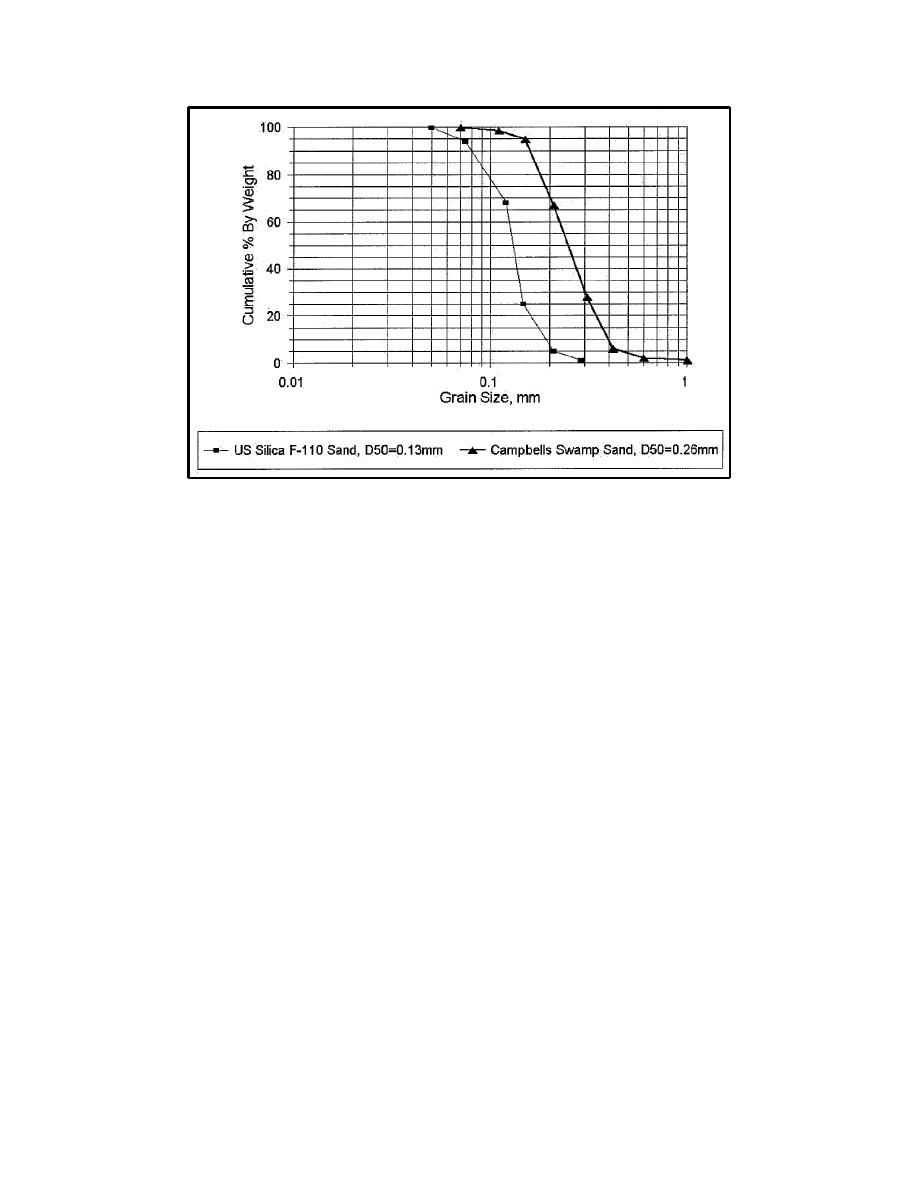
Figure 3.
Grain size distributions of sands used in this study
measurements, perfomed by hand, measured down from a reference datum. The
top of a 15-cm (6-in.) aluminum box beam was the reference. Depth measure-
ments were made from the top of the beam to the sand bed at a variable spacing
that defined breaks in slopes (horizontal spacings were as close as 1.5 cm (0.6 in.),
and vertical (depth) measurements were read to 0.3 cm (0.12 in.).
At the start of a test, cross-sectional measurements were made at five locations
across the inlet gorge area, spaced 0.6 m (2 ft) apart (Figure 4). Initially, for the
longer tidal period, all the locations were periodically measured until a configura-
tion of the inlet was reached where one location was the obvious minimum area,
and this range was monitored from then on. Measurements were made during the
test operation and were taken during slack water. For the shorter tide period, be-
cause of the short time span for slack water, measurements were usually limited to
the minimum area cross section.
The tide was run without the aid of the storage tanks, so the bay area of
2,713 sq m (29,000 sq ft) contained the tidal prism. The length of the tidal waves
used was much greater than the bay dimensions, so that the assumption of a uni-
formly rising bay could be invoked to determine the tidal prism by multiplying
surface area by bay tide range.
9
Chapter 3 Experiment Procedures


 Previous Page
