

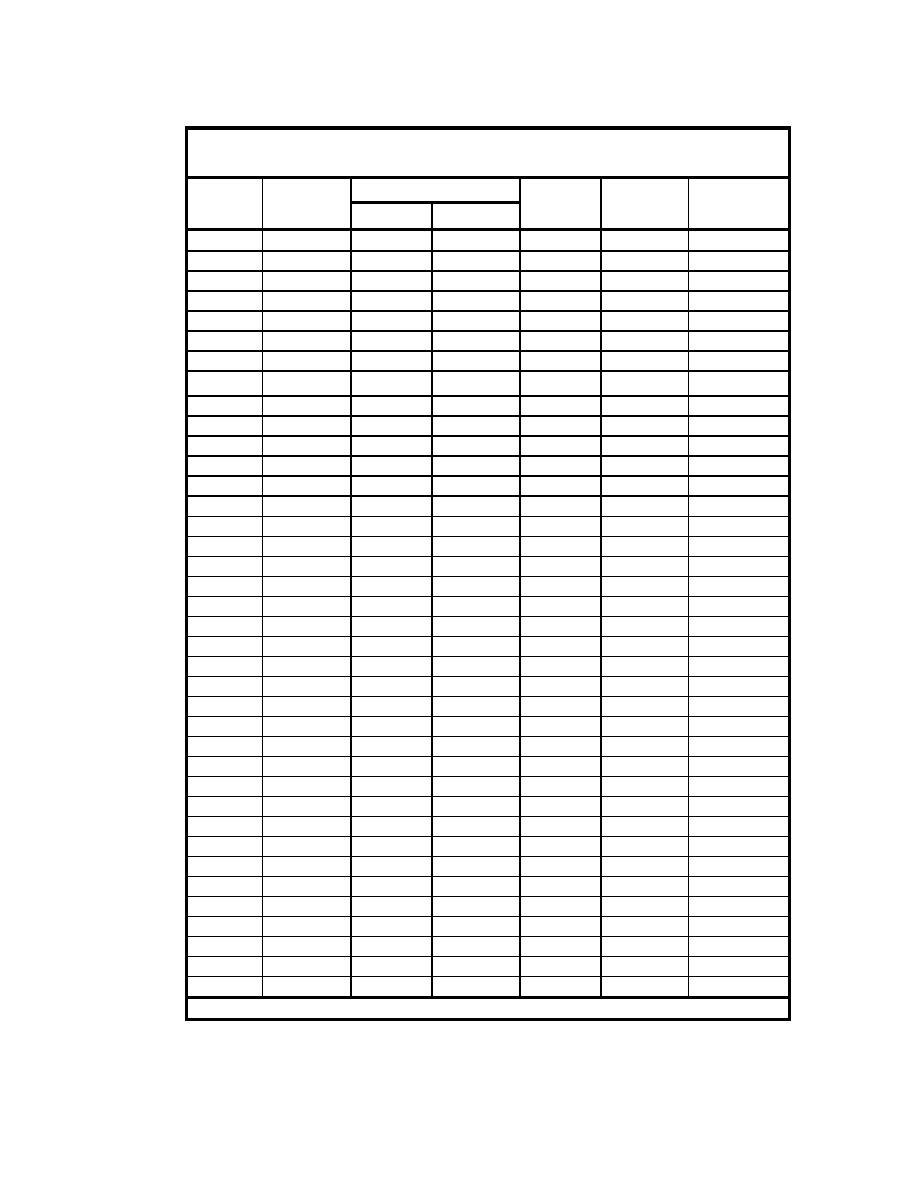
Table B1
CIRP Run 4
Bay Tide
Head
Minimum
Max Inlet Velocity, cm/sec
Run Time
Range
Difference
Cross-Section
Cycle
min
Flood
Ebb
inches
inches
Area, sq ft
0
0
0.449
1
26.35
0.139
0.82
0.508
1.5
39.525
0.534
2
52.7
0.125
0.81
0.518
2.5
65.875
0.573
3
79.05
0.542
3.5
92.225
0.552
4
105.4
0.124
0.8
0.536
4.5
118.575
0.587
5
131.75
0.567
5.5
144.925
0.604
6
158.1
37
0.126
0.8
0.566
6.5
171.275
-41
0.594
7
184.45
0.562
7.5
197.625
0.58
8
210.8
40
0.131
0.8
8.5
223.975
-39
0.599
9
237.15
9.5
250.325
10
263.5
41
0.136
0.79
10.5
276.675
-39
11
289.85
11.5
303.025
12
316.2
43
0.137
0.79
12.5
329.375
-39
13
342.55
13.5
355.725
14
368.9
40
0.141
0.78
14.5
382.075
-39
15
395.25
38
0.143
0.79
15.5
408.425
-41
0.569
16
421.6
29
0.12
0.69
16.5
434.775
-28
0.626
17
447.95
17.5
461.125
0.604
18
474.3
30
0.12
0.67
18.5
487.475
-28
0.615
19
500.65
(Sheet 1 of 8)
B2
Appendix B Data Time Series

 Previous Page
