

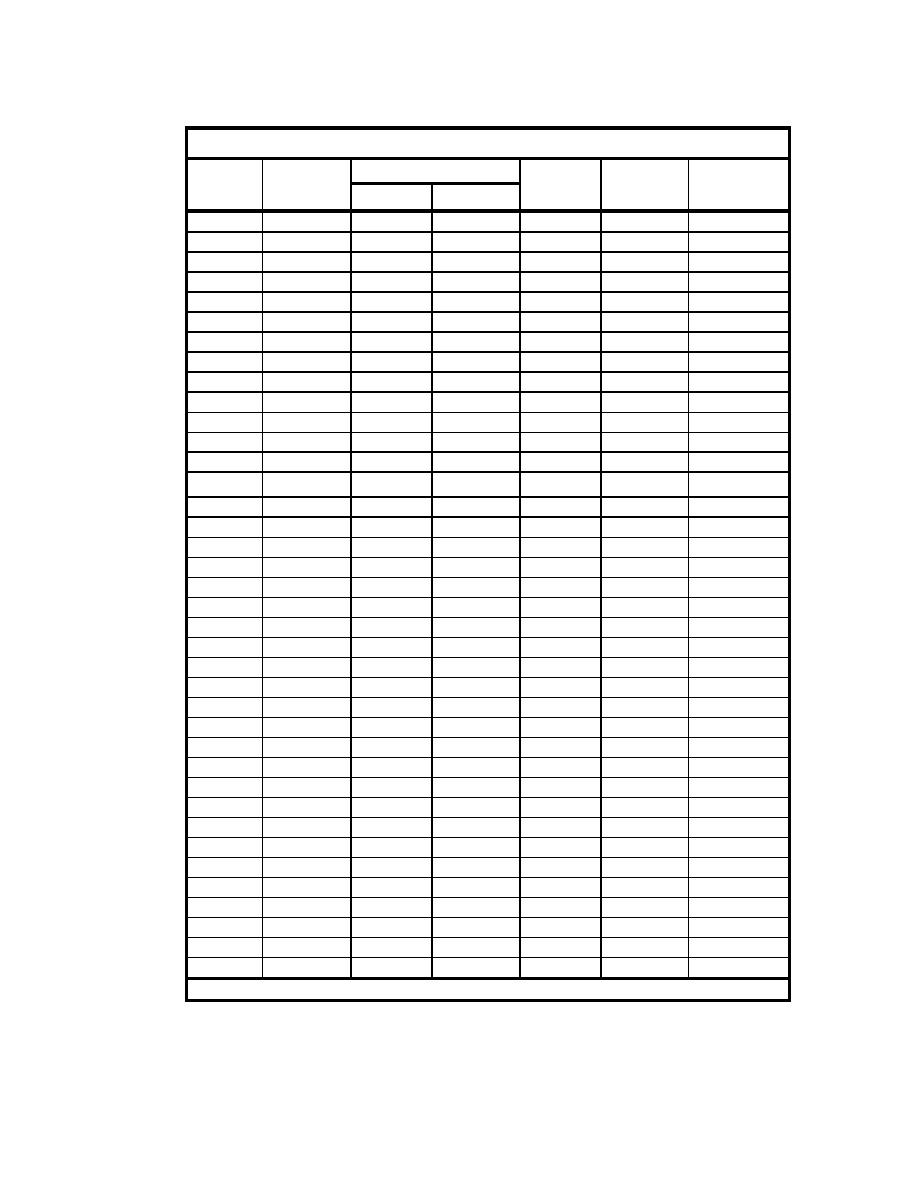
Table B1 (Continued)
Max Inlet Velocity, cm/sec
Bay Tide
Head
Minimum
Run Time
Range
Difference
Cross-Section
Cycle
min
Flood
Ebb
inches
inches
Area, sq ft
38.5
1014.475
-27
0.55
39
1027.65
39.5
1040.825
40
1054
26
0.12
0.69
40.5
1067.175
-18
0.546
41
1080.35
41.5
1093.525
42
1106.7
25
0.12
0.68
42.5
1119.875
-22
0.584
43
1133.05
43.5
1146.225
44
1159.4
29
0.12
0.69
44.5
1172.575
-28
0.597
45
1185.75
25
0.69
45.5
1198.925
-28
0.12
0.59
46
1212.1
0.66
46.5
1225.275
0.592
47
1238.45
47.5
1251.625
48
1264.8
-24
0.1
0.68
48.5
1277.975
49
1291.15
49.5
1304.325
50
1317.5
29
-27
0.1
0.67
0.531
50.5
1330.675
51
1343.85
51.5
1357.025
52
1370.2
25
-28
0.1
0.69
0.599
52.5
1383.375
53
1396.55
53.5
1409.725
54
1422.9
23
-17
0.1
0.67
0.599
54.5
1436.075
55
1449.25
55.5
1462.425
56
1475.6
20
-15
0.1
0.69
0.58
56.5
1488.775
57
1501.95
(Sheet 3 of 8)
B4
Appendix B Data Time Series

 Previous Page
