R.J. Sobey, S.A. Hughes r Coastal Engineering 36 (1999) 1736
23
Table 1
Sample theoretical waves
H
h
T
U1
U2
zP
zUV
Wave
Five
3m
5m
10 s
y1.902
y0.618
y5.0 m
y5.0 m
Twenty
10 m
20 m
10 s
y0.951
y0.309
y10.0 m
y10.0 m
Hundred
20 m
100 m
10 s
y0.478
y0.155
y20.0 m
y20.0 m
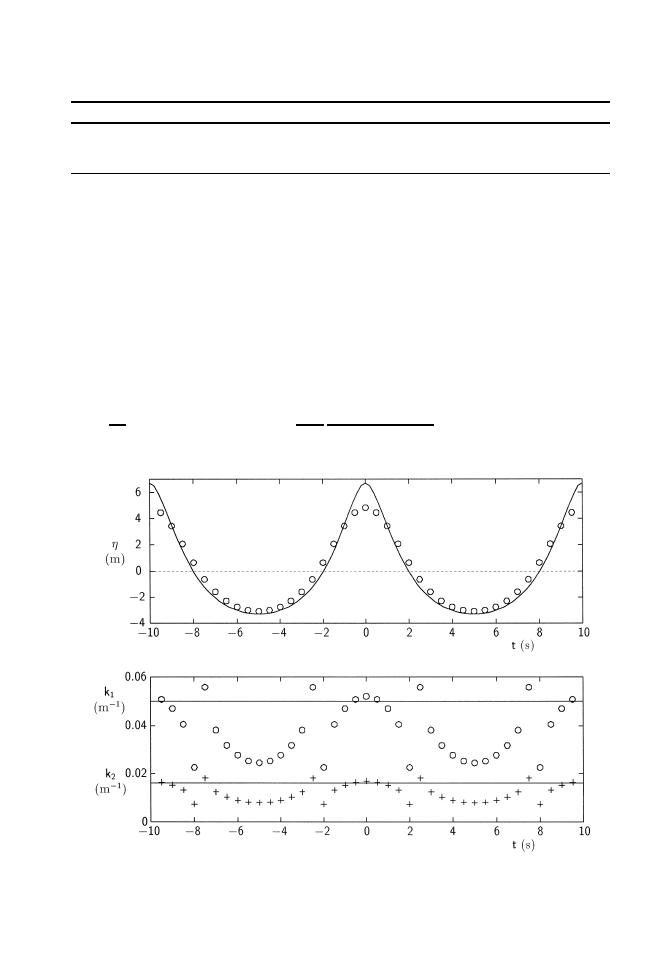
The predicted water surface elevation and wave number components from the local
linear algorithm are shown in Fig. 3 as the markers, together with the near-exact
predictions from global Fourier wave theory as the solid lines. Solutions to Eq. Z14. at
times in the immediate neighborhood of the zero-crossings were difficult to obtain, and
required initial solution estimates that were almost exact. For this ` wave transitional'
situation, a solution was obtained throughout. It is smooth and visually convincing,
except when compared with the near-exact predictions. There is order of magnitude
agreement only. The crest elevation in particular is poorly predicted.
Some variations on the locally linear formulation may achieve a more acceptable and
perhaps also more robust local solution, but the indications are not encouraging.
Eliminating h between the f2 and both the f3 and f4 equations gives:
r g cosh kZ h q z P .
ka
Z v y ka Ua . s Z uabs y Ua . obs
o
tanh kh.
Z 16.
k
pd cosh kZ h q z UV .
Fig. 3. Local linear theory Zmarkers. and global Fourier theory Zsolid lines. predictions for Record `Twenty'.


 Previous Page
