R.J. Sobey, S.A. Hughes r Coastal Engineering 36 (1999) 1736
33
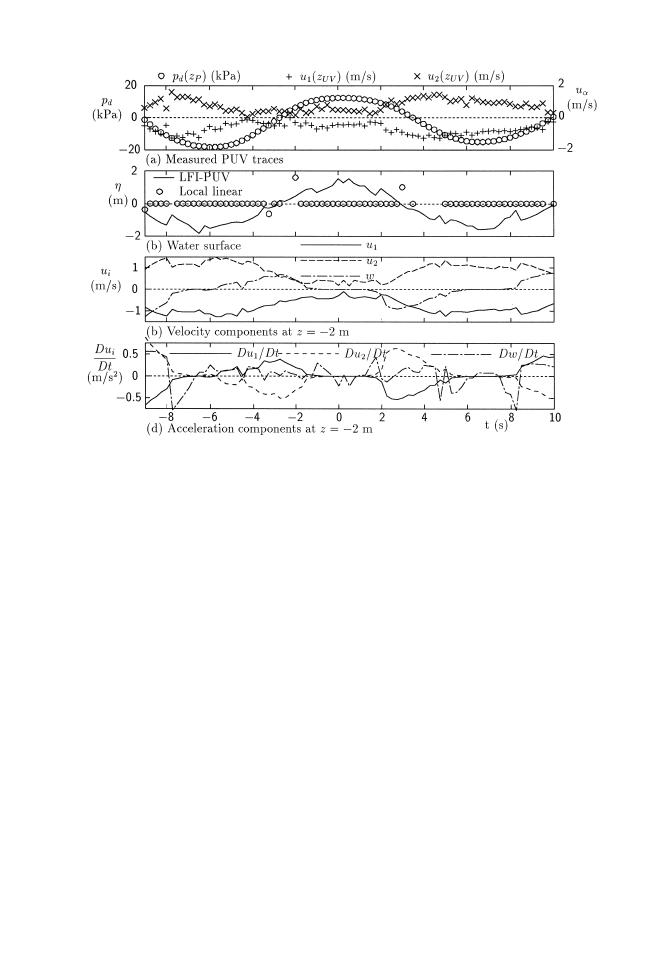
Fig. 9. LFI-PUVw3,3,0.2x predictions from Columbia River data.
Z1992. LFI-E theory for irregular wave kinematics from single-point water surface
traces, a window width of t 0rTz s 0.1 was routinely satisfactory. For PUV traces, the
observational equations are somewhat less authoritative. An obvious reason is the
relatively large error bands on the UV measurements. Another possible reason is natural
signal attenuation with depth of submergence; the higher frequencies are most rapidly
attenuated and their influence may get lost in the error bands ZBarker, 1998.. Neverthe-
less, experience suggested the routine adoption of a slightly wider window width of
t 0rTz s 0.2. Barker and Sobey Z1996. also recommended this same window width for
irregular wave kinematics from pressure records alone.
It is instructive, nevertheless, to compare the locally nonlinear prediction of sea
surface elevation with the locally linear prediction Zshown as the markers on Figs. 8b
and 9b.. The density of the linear solutions match the data resolution. In Fig. 8b, D t is
1.0 s. Where there is no solution Zsee Eq. Z17. and following., the marker is located at
the MWL, as at times y4, y3 y2, 2, 6, 7 and 10 s. Solutions at 0, 1 and 9 s are
significantly off scale, and only those at y1, 3, 4, 5 and 8 s have any credibility. In Fig.
9b, D t is 0.25 s. There are many `no solution' markers and the few locations where
linear solutions were obtained are mostly off-scale or have little credibility. The
theoretical reservation on the linear method, potentially significant underprediction at the
crest Zsee Fig. 3., is clearly overwhelmed by the frequency of either `no solution' results
or solutions that have no visual credibility. The linear method must be rejected on both
theoretical and practical grounds.


 Previous Page
