Home
Download PDF
Order CD-ROM
Order in Print
Home
>
Costal Inlets Research Program
>
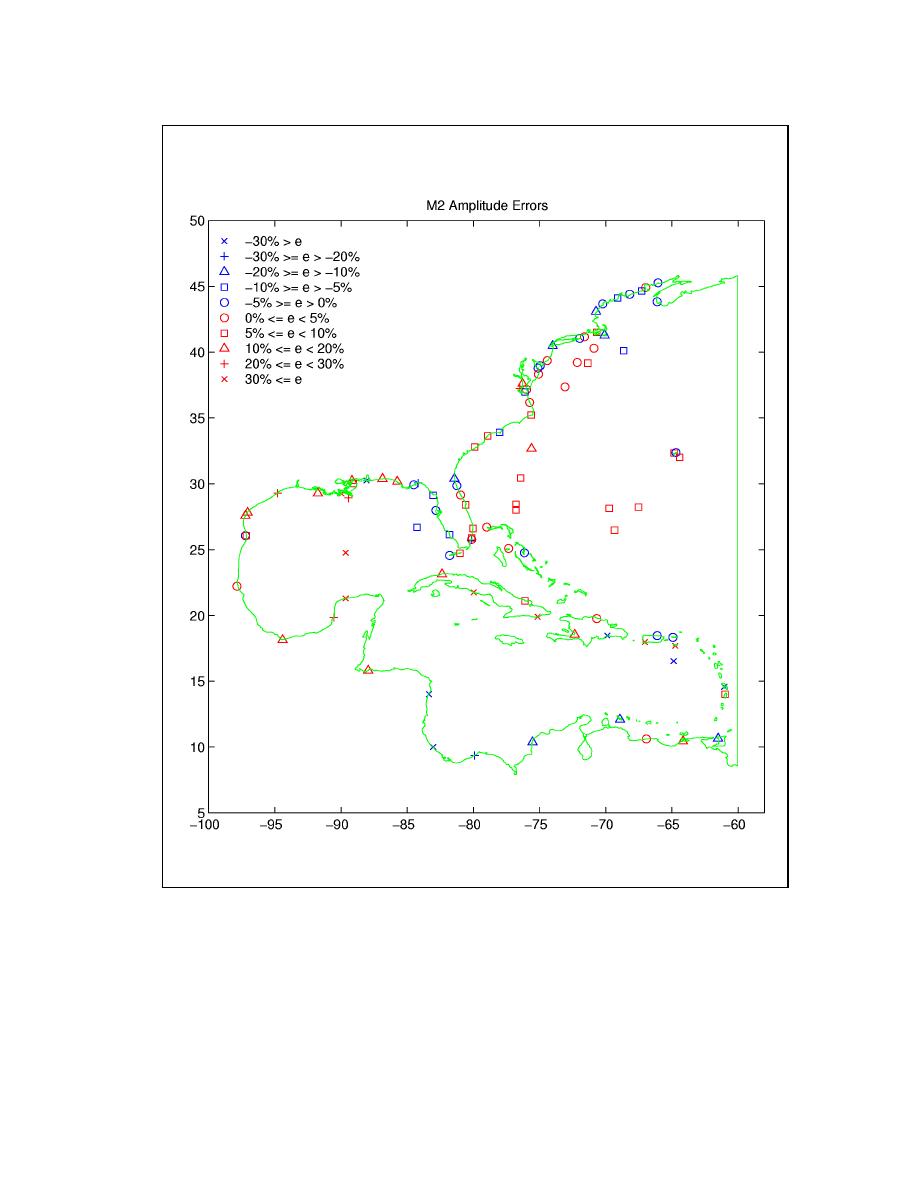
> Figure 139. Distribution of M2 amplitude errors at stations
Figure 138. Distribution of Q1 phase errors at stations
Figure 140. Distribution of M2 phase errors at stations
TR-02-24
Page Navigation
160
161
162
163
164
165
166
167
168
169
170
Figure
139.
Distribution
of M
2
amplitude
errors
at
stations


 Previous Page
