Home
Download PDF
Order CD-ROM
Order in Print
Home
>
Costal Inlets Research Program
>
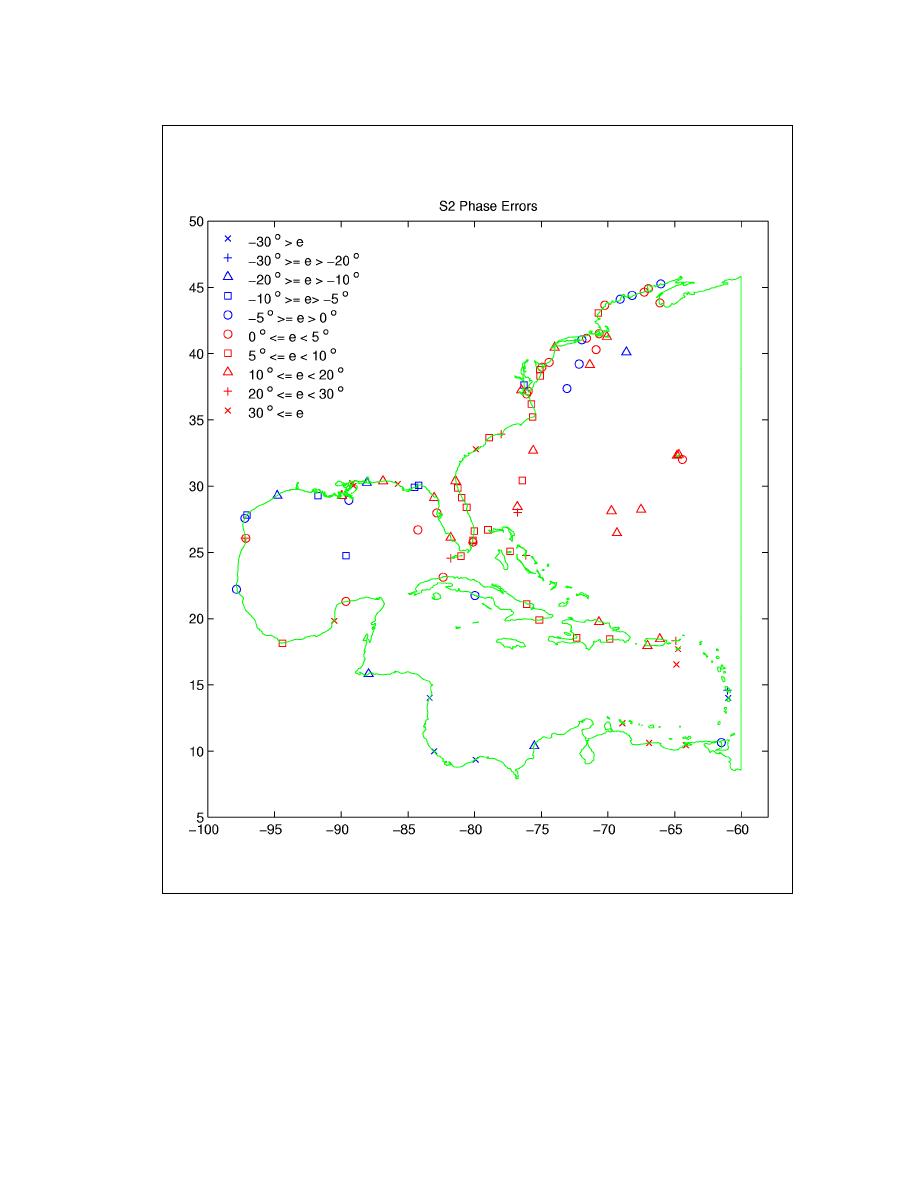
> Figure 142. Distribution of S2 phase errors at stations
Figure 141. Distribution of S2 amplitude errors at stations
Figure 143. Distribution of N2 amplitude errors at stations
TR-02-24
Page Navigation
163
164
165
166
167
168
169
170
171
172
173
Figure
142.
Distribution
of S
2
phase
errors
at
stations


 Previous Page
