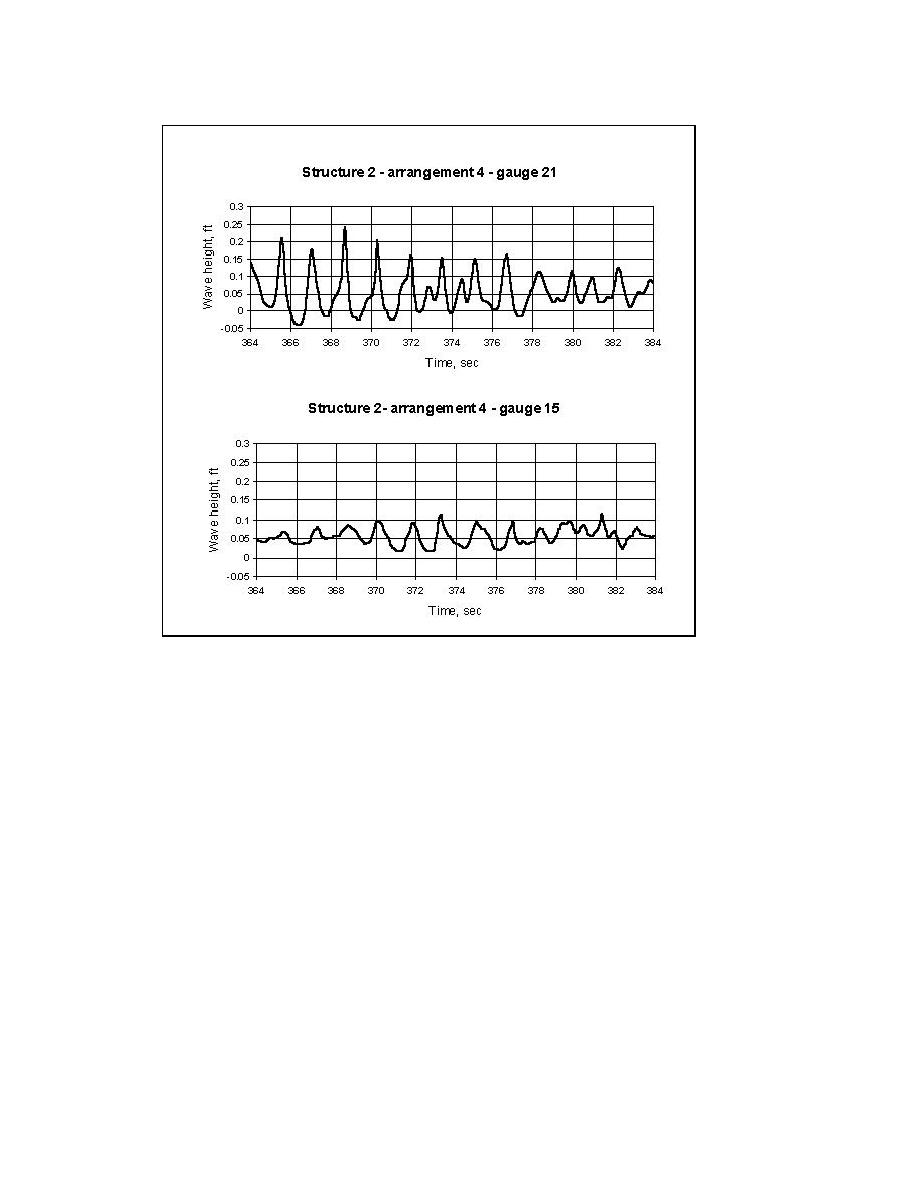
Figure 14. Time series of water-surface elevation η at wave generator
(Gauge 21 and Gauge 15)
Tables 3 and 4 list the parameters available from the data analysis, which are
available on compact disk (CD) from the Coastal and Hydraulics Laboratory,
U.S. Army Engineer Research and Development Center. Water level variation
and velocity data are also included in CD format for all experiments discussed in
this report.
It should be noted that entire data records were analyzed to produce the
tables of wave parameters. It was observed that for Structures 3 and 4 there were
some transient and unsteady effects in the wave records, typically at the start of
data collection. These effects may have resulted from different processes. First,
especially for Structure 3, longshore currents, created by breaking waves along
the shoreline, could be observed during these experiments; and these currents
were moving into the inlet from both beaches. Once in the inlet, these wave-
induced currents would then turn seaward and interact with the incoming waves.
Within the narrow inlet, reflected waves from the sides of the inlet appeared to
converge and interact at the center of the narrowest and deepest part of the inlet
channel. On the bay side of the inlet, slow circulation patterns were created that
took a while to develop. The transient effects seemed to be stronger for the
20
Chapter 3 Measurement Procedures and Data Analysis


 Previous Page
