

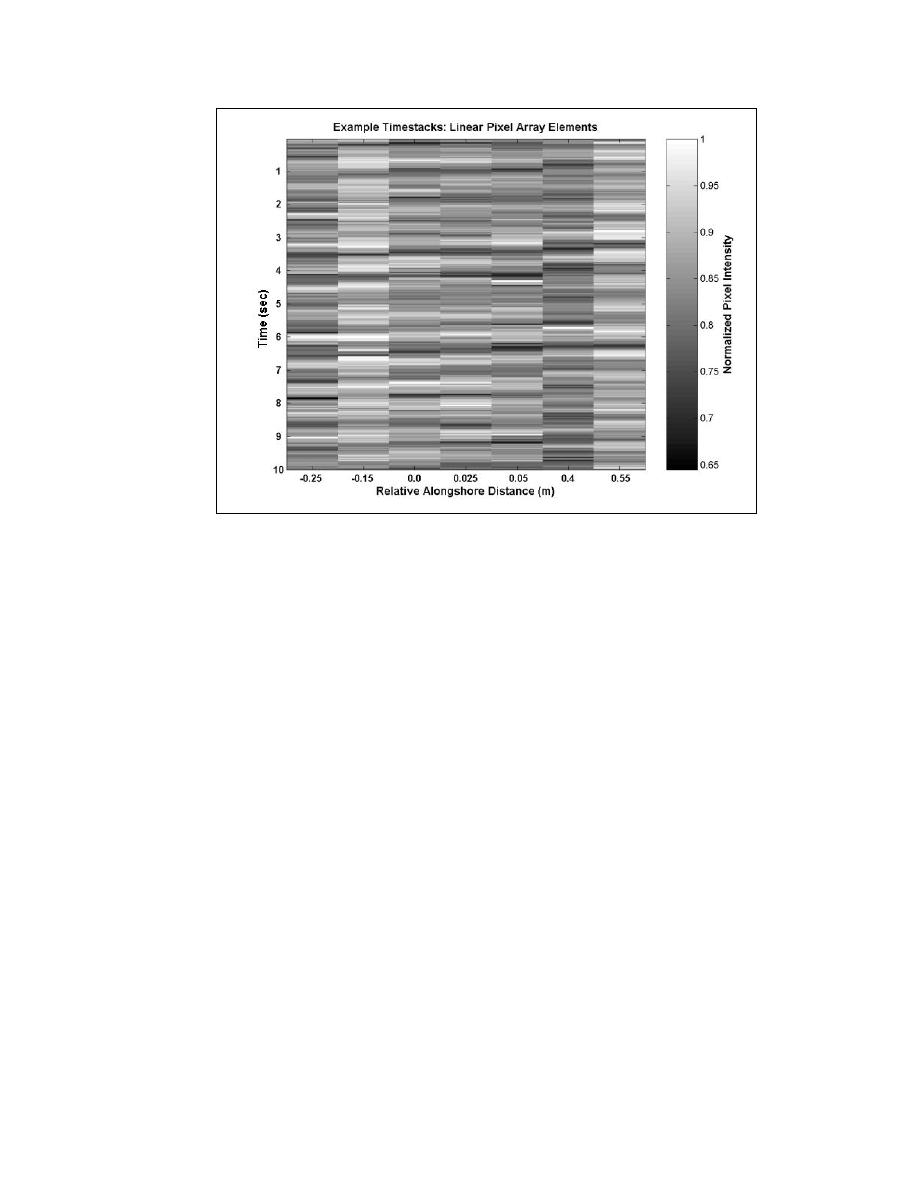
Figure 35.
Example 10-sec normalized timestacks obtained from the
alongshore elements of a cross-shaped array during a spectral
wave experiment
Estimates of the normalized cospectra and quadspectra are obtained from
Fourier transforms of sensor pair timestacks. Each timestack is 7 min in duration
and consists of 12,600 samples. To improve computational performance,
frequencies above 3 Hz were not considered for analysis. Timestacks were
linearly detrended, tapered, and divided into six ensembles of 2,048 samples and
band averaged resulting in a frequency resolution of 0.0439 Hz and 36 deg of
freedom.
With each physical model configuration (Structure) and generated wave
spectrum (Experiment), the direction region represented a broad range of wave
heights. In addition, a gradient in light illuminated the measurement areas.
Therefore, noisy pixel intensity signals and low coherence between sampling
elements of pixel arrays were anticipated. For example, low-amplitude and low-
variance pixel intensity fluctuations may be observed across a poorly illuminated
array. Conversely, high pixel intensity and low variance may be observed across
array elements in brightly lit areas. The coherence-squared function was
calculated for all possible gauge pairings in an array. To avoid spurious results
in the calculation of θm( f ), a coherence-squared threshold amplitude value of 0.7
was arbitrarily selected. Coherence-squared estimates equal to or above the
threshold value indicate meaningful coherence between array element pairings.
Only frequency content of array pairings with meaningful coherences was
meeting the coherence cutoff criteria are typically at or near the spectral peak.
49
Chapter 5 Video-Based Wave Direction Measurement

 Previous Page
