Validation
Video measurements of θm(f) are validated against collocated in situ ADV
probe measurements. ADV observations of horizontal velocity components were
sampled at a rate of 20 Hz for a duration of 204.8 sec, resulting in 4,096 samples.
Time series records were linearly detrended, tapered, and ensemble averaged
resulting in a frequency resolution of 0.078 Hz and 32 deg of freedom with a
maximum frequency cutoff of 5 Hz.
To facilitate comparison, ADV energy density and direction values were
interpolated using a piecewise cubic Hermite interpolation within the frequency
bands observed by the video system. Superimposed on the rectified (lower)
images shown in Figures 26, 27, 29, 31, and 32 are solid circles that represent
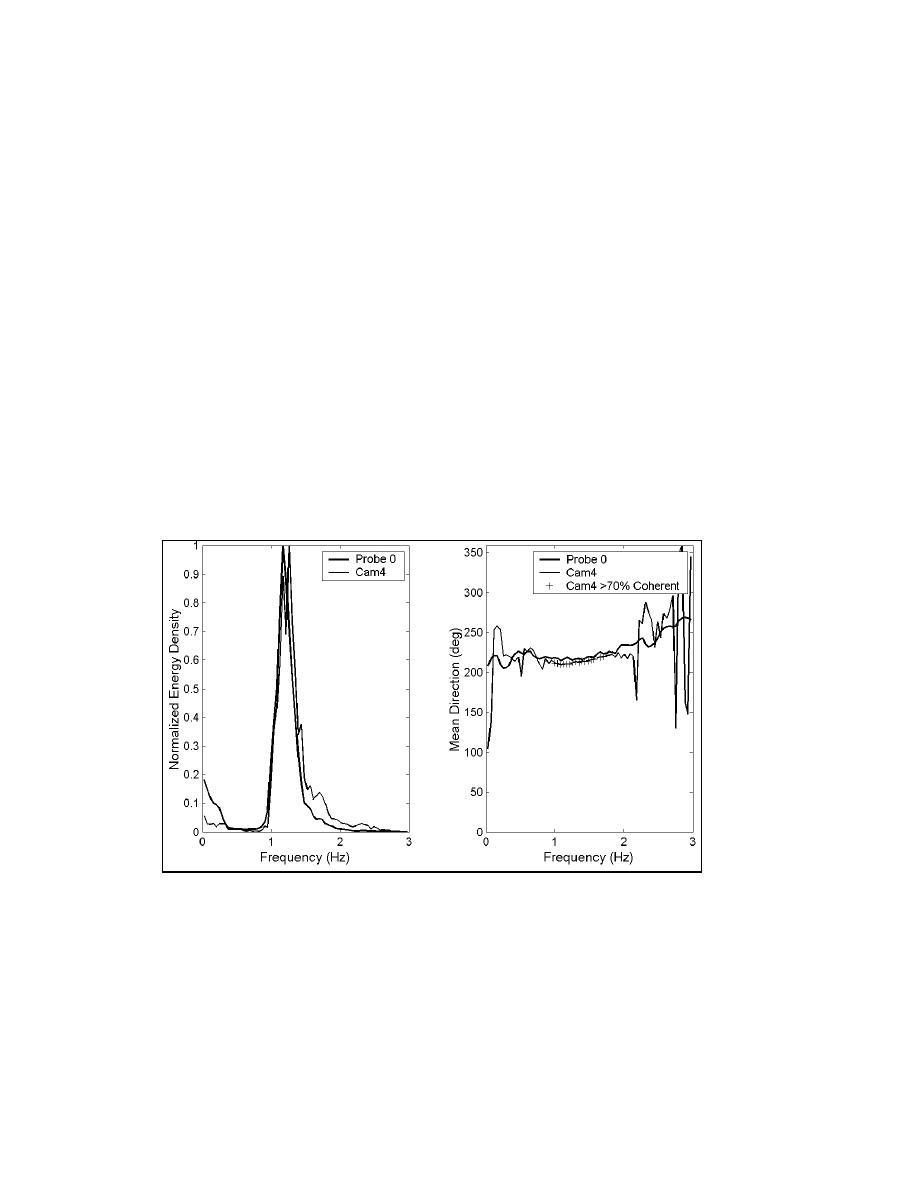
ADV and CIIS measurement collocations. Figure 36 is a representative graphical
comparison of normalized energy density and direction versus frequency at a
single measurement location for a random wave experiment (fpeak= 1.25 Hz). The
peak spectral density for graphical comparison normalizes the variance spectrum.
For visual reference, Appendix P presents a graphical comparison of energy
density and mean direction versus frequency for each Structure 1 collocated
CIIS-ADV location.
Figure 36. Representative collocated video-ADV spectra
Several statistics were selected to compare mean wave directions obtained
near the peak of the spectra for the two measurement techniques. These statistics
include mean angular difference (scalar wave direction bias), standard deviation
of mean angular difference, root-mean-square error and correlation coefficient.
These statistics are defined as follows for Xi (ADV observation) and Yi (CIIS
observation), and a wave direction vector magnitude of unity:
50
Chapter 5 Video-Based Wave Direction Measurement


 Previous Page
