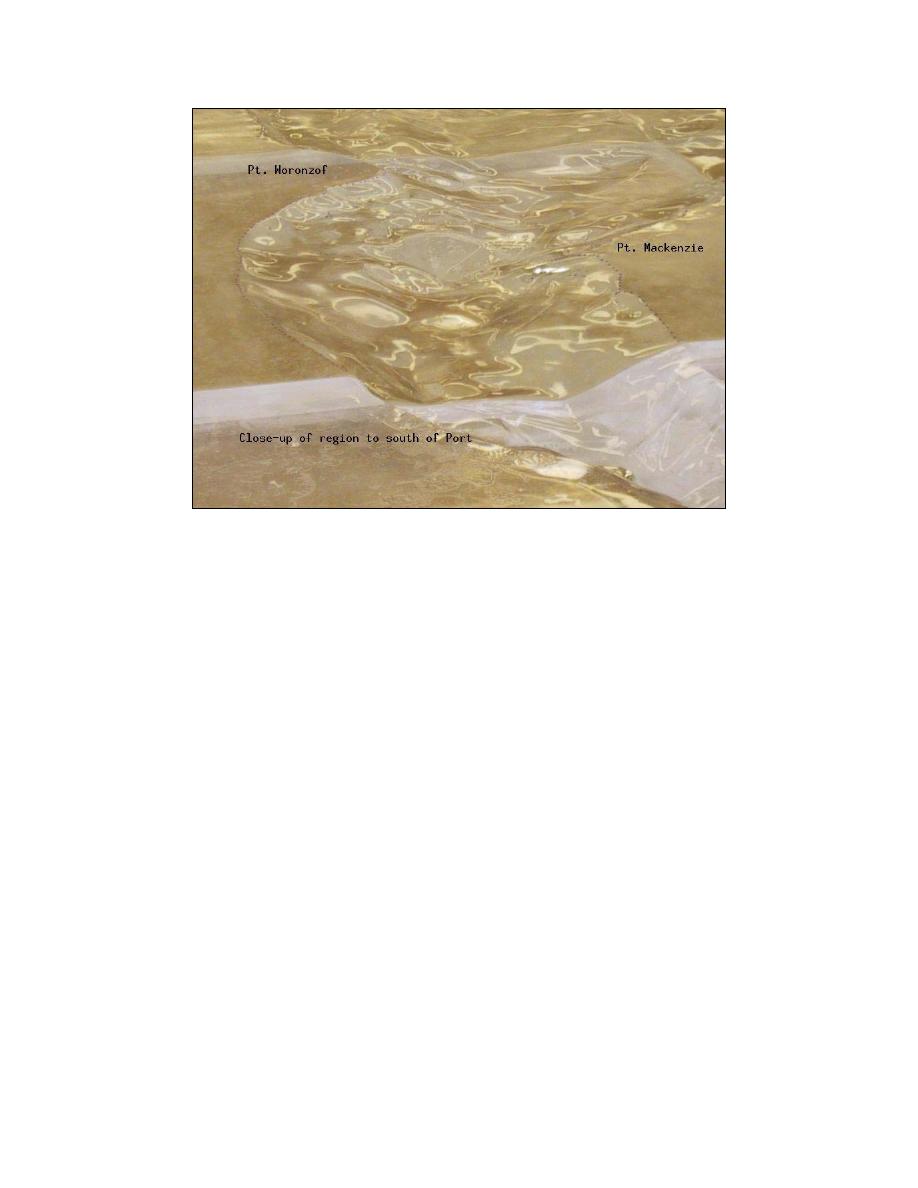
Figure 65. Close-up view looking downstream south of Port of Anchorage
Model operation
Operation of the 3-D Cook Inlet model is essentially the same as for the
idealized models discussed in Chapter 3. Four sections of the six-section model
were placed on the flow table as illustrated in Figure 66, and the water level was
adjusted for a specified tide elevation (usually mhw or mtl) using the adjustable
weir located at the downstream end of the flow table. After turning on the
circulation pump, the steady flow rate was adjusted to the scaled discharge value
representing the target total discharge at Cook Inlet. (Simulation of a variable-
flow tide hydrograph was not supported at this time.)
Flow visualization techniques using dye injection and tracers (surface and
bottom) were used to determine regions of flow separation, flow entrainment,
and reduced-flow areas where fine sediment would be deposited. The dye
revealed the 3-D nature of the turbulence, and was injected using different sized
syringes. One method was to squirt a line of dye across the principle flow
direction to observe how it translated downstream. A second method was to
continually introduce dye at an upstream point so a pathline formed as the dye
moved downstream. Baby powder worked well as a tracer.
Changing between ebb and flood tide was accomplished by rotating the
entire model by 180 deg on the flow table so the water flowed in the opposite
direction. The region of interest was changed by removing a section on one end
and adding a section on the opposite end. The effect of shoal migration was
examined by moving existing shoals or creating new shoals using Silly PuttyTM
or floral clay.
81
Chapter 7 Three-Dimensional Cook Inlet Model


 Previous Page
