

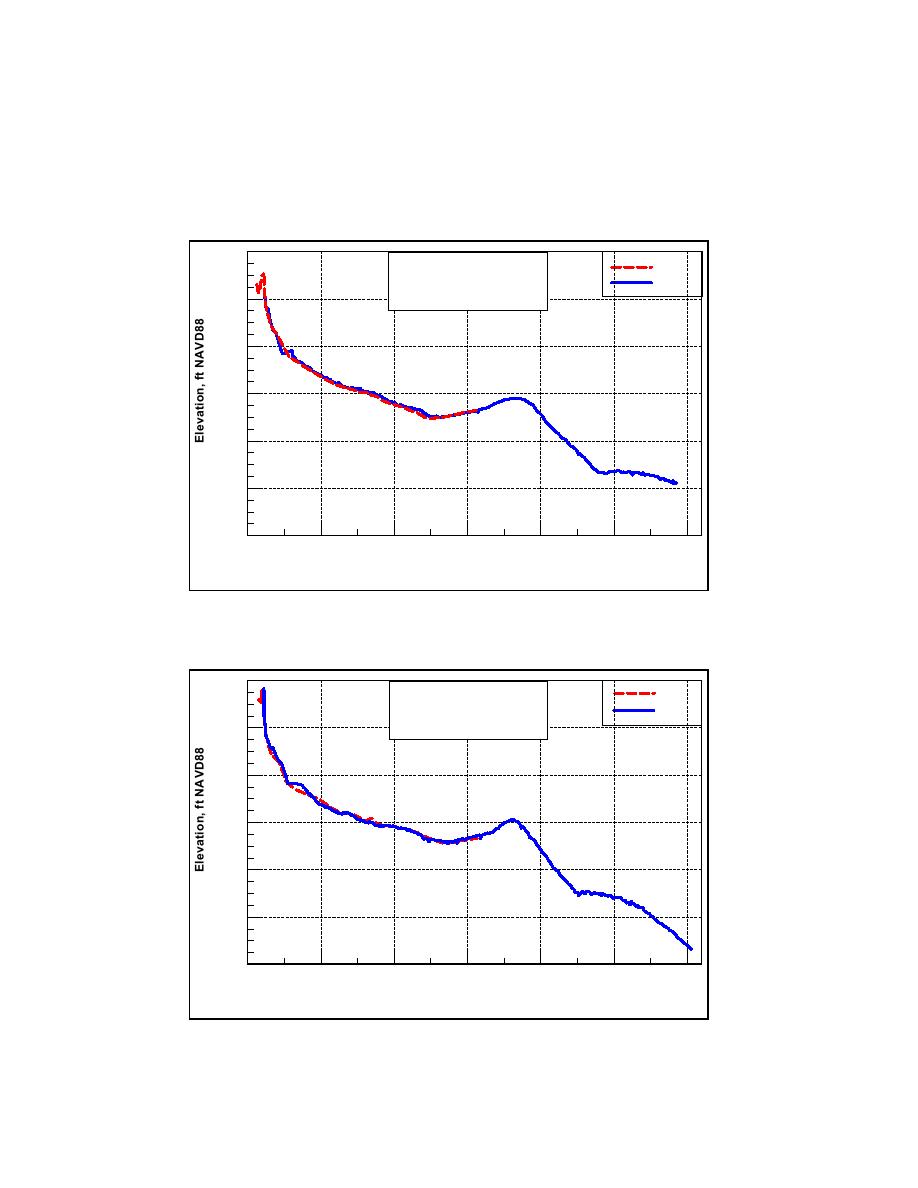
Figures 4-2a to 4-2f plot 1998 (OCTI 1998) and 2002 beach profile survey
for the offshore area east of Mattituck Inlet and cover the shoal located
approximately 1,660 ft offshore. The profiles indicate stability of this feature for
the 4-1/2-year interval and a stable shoreline with small amounts of recession at
some locations to the east of Mattituck Inlet.
20
Mattituck Profile Comparison
1998
Mar 1998 and 6-8 Oct 2002
2002
Line E 4 (Approx. 600 ft
10
East of East Jetty)
0
-10
-20
-30
-40
-100
400
900
1400
1900
2400
2900
Distance Across Shore, ft
Figure 4-2a. Offshore shoal cross-shore profile E4, March 1998 and 6-8 October
2002
20
Mattituck Profile Comparison
1998
Mar 1998 and 6-8 Oct 2002
2002
Line E 5 (Approx. 1,100 ft
10
East of East Jetty)
0
-10
-20
-30
-40
-100
400
900
1400
1900
2400
2900
Distance Across Shore, ft
Figure 4-2b. Offshore shoal cross-shore profile E5, March 1998 and 6-8 October
2002
106
Chapter 4 Morphology Change, and Channel Shoaling and Migration

 Previous Page
