

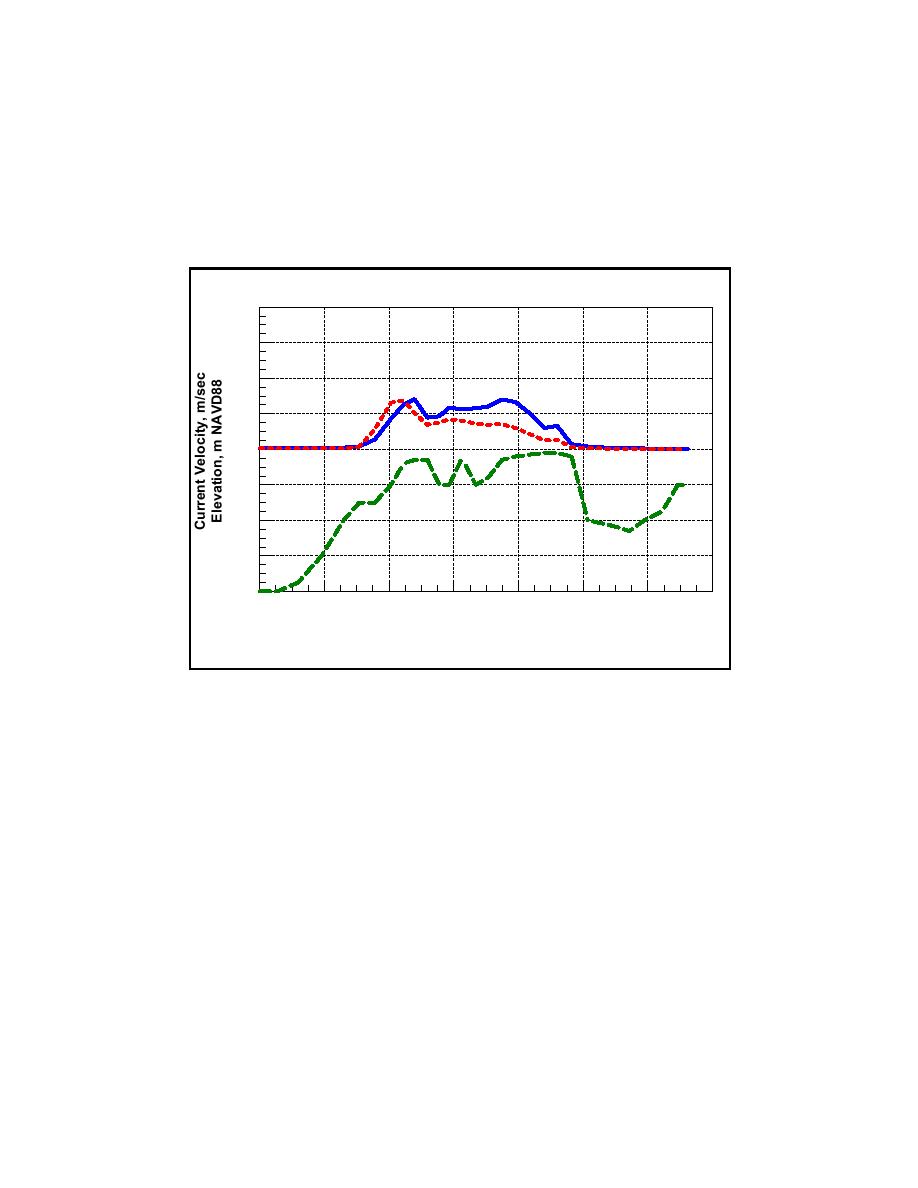
Figure 5-27 plots the maximum calculated velocity at each node for a spring
flood tide and the subsequent ebb tide on 7 October 2002, together with the
elevation. The flood current had maximum velocity of 1.43 m/sec for this time
interval. Strong flood-tidal currents persist to the exit of the channel into
Goldsmith Pond. The ebb current at the mouth exceeds 1 m/sec.
4
3
2
Flood
1
Ebb
0
-1
Elevation
-2
-3
-4
0
100
200
300
400
500
600
700
20
25
16
30
8
6
12
0
Distance along Dynlet Channel (m)
Node numbers below in red
Figure 5-27.
Maximum calculated flood- and ebb-spring-tide current speed and
water elevation at Goldsmith Inlet, 7 October 2002
Figure 5-28a and 5-28b display composite surfaces of maximum calculated
flood and ebb velocity, respectively, at all node stations for hours 400 to 450 of
the model run. Larger-scale views of these velocities within the channel are
shown in Figures 5-28c and 5-28d. The time interval corresponds to 7-8 October
2002, a spring tide, giving maximum velocities experienced at these locations.
Figure 5-28e shows a difference map between these surfaces that illustrates the
magnitude of current velocity asymmetry throughout the surface.
A strong flood current persists over the entire channel and into the pond,
whereas the ebb current is weak over much of the channel and pond, except at the
mouth of the inlet. Such behavior would tend to transport sediment, particular
sand, toward Goldsmith Pond, promoting flood shoal development and growth.
The strong ebb current at the entrance would tend to maintain the inlet by
sweeping finer sediments away from the mouth. However, sediment brought into
the inlet on flood will not be flushed on ebb, promoting closure by constriction
inside the inlet and not necessarily at the mouth.
261
Chapter 5 Circulation Analysis

 Previous Page
