

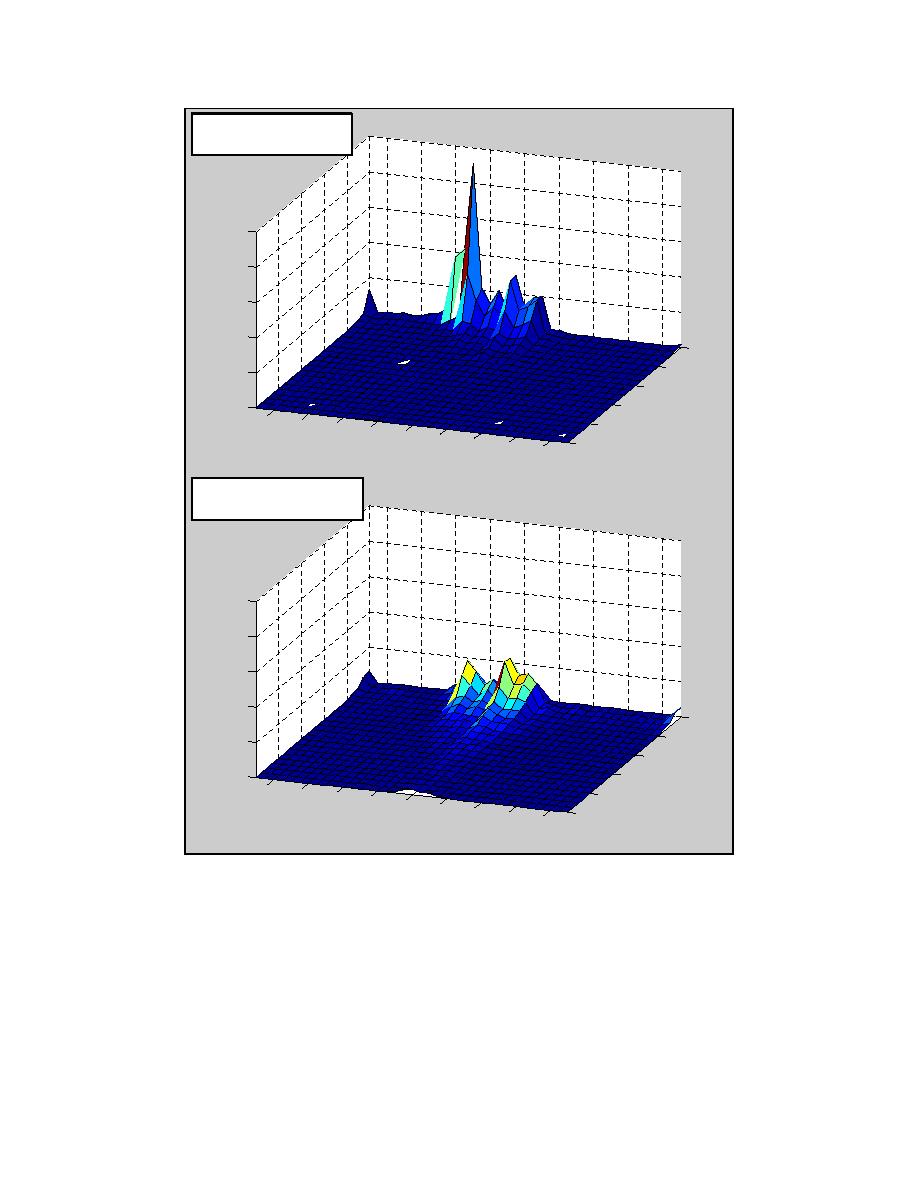
Spring/Summer
(April September)
25
20
15
10
0
5
2
4
4
x 10
0
6
140
120
100
8
W a ve Pow e r(W m -1
80
60
40
20
0
10
-20
Fall/Winter
(October March)
25
20
15
10
0
5
2
4
4
x 10
0
6
140
120
100
8
W a ve Pow e r(W m -1
80
60
40
20
0
10
-20
Fig. 3. Seasonal joint probability distributions of wave power vs. direction.
Shorter-term measurements of wave data in the vicinity of Sebastian Inlet are consistent with the
interpretation of the WIS data (Fig. 5). The winter months are characterized by episodes of high
longshore energy flux, whereas during the summer months, higher energy events are rare, and
longshore sand transport is likely to be small. Based on analysis of wave power from the nearshore
Sebastian Inlet wave gauge, net sand transport should be to the south in the winter and largely driven
by storms. Transport in the summer months is weaker and more balanced between north and south-
directed components.
4
Zarillo et al.

 Previous Page
