Table 1 Sebastian ebb and flood shoal volumes
in cubic meters
Date
Ebb Shoal
Flood Shoal
6/30/58
6.86E+05
6/30/84
1.01E+06
9/15/89
1.72E+06
1.64E+06
9/15/90
1.63E+06
1.57E+06
3/15/91
1.66E+06
1.56E+06
9/15/91
1.65E+06
1.55E+06
3/15/92
1.66E+06
1.59E+06
9/15/92
1.64E+06
1.57E+06
3/15/93
1.64E+06
1.59E+06
9/15/93
1.68E+06
1.59E+06
3/15/94
1.67E+06
1.63E+06
9/15/94
1.65E+06
1.55E+06
3/15/95
1.64E+06
1.60E+06
9/15/95
1.62E+06
1.51E+06
3/15/96
1.64E+06
1.57E+06
9/15/96
1.61E+06
1.58E+06
3/15/97
1.60E+06
1.57E+06
9/15/97
1.57E+06
1.59E+06
3/15/98
1.60E+06
9/15/98
1.62E+06
1.61E+06
3/15/99
1.60E+06
9/15/99
1.67E+06
1.52E+06
3/15/00
1.60E+06
Ebb Shoal
Qin
VEe
Bypassing Bar
(QB)in
Attachment Bar
VE
(QA)in
VBe
(QE)out
(Qbeach)in
VAe
VB
(QB)out
VA
(QA)out
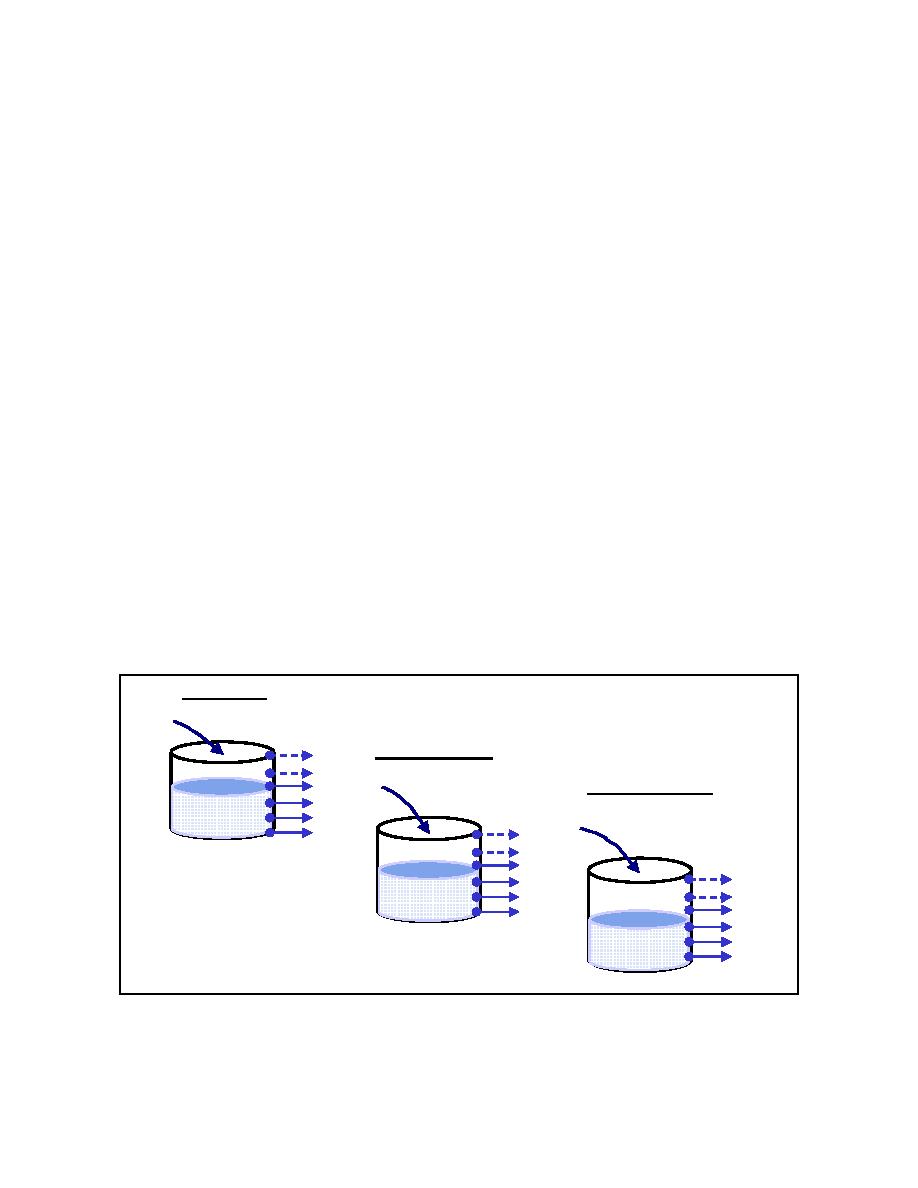
Fig. 8. Conceptual diagram for the Reservoir Model (from Kraus 2002).
10
Zarillo et al.


 Previous Page
