

central Fire Island using the April 1995 shoreline data set. After extracting the shoreline
undulation signal from the shoreline position data, the next step involved processing the
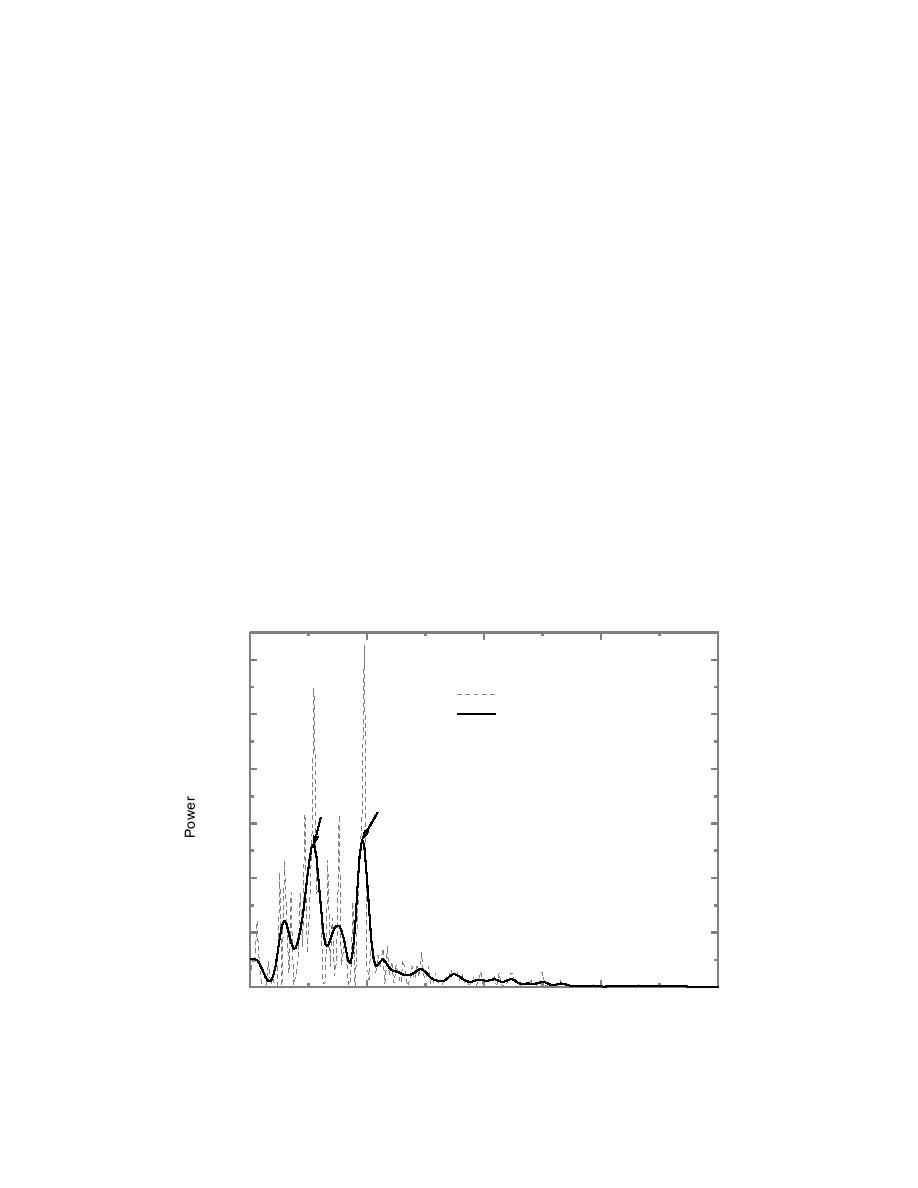
shoreline undulation data through the FFT analysis routine. The power spectrum
estimates that resulted from the analysis were smoothed, and spectral peaks in the
smoothed version of the power spectrum were used to identify the dominant shoreline
undulation wavelengths. An example of the raw and smoothed power spectrum that
resulted from the FFT analysis of the April 1995 shoreline undulation data set is provided
in Fig. 6. Each of the shoreline undulation data sets were processed as described above
and comparable results were obtained. Table 2 provides a summary of the results
obtained from the spectral analysis. From Table 2 it is seen that in general only two
spectral peaks were identified from the shoreline position data sets that were interpreted
from aerial photography (only the March 1988 data set gave three spectral peaks). The
corresponding shoreline undulation wavelengths were found to range from about 1 to
1.8 km. The data sets that were obtained by GPS survey methods resulted in the
identification of not less than two and often more than three spectral peaks corresponding
to shoreline undulation wavelengths in the 1 to 3-km range with most peaks concentrated
in the 1 to 2-km wavelength range. The reason for the difference in the number of
spectral peaks is unknown but believed to be a result of the different data capture methods
used (photo interpretation versus on-the-ground survey). Of importance however, is that
the statistically significant wavelengths of the shoreline undulations were found to be
generally in the same range regardless of the data capture method. Based on the described
spectral analysis it is concluded that the predominant wavelength associated with shoreline
undulations on Fire Island ranges between about 1 and 2 km.
-2
1.2x10
Raw Power Spectrum
Smoothed Power Spectrum
-2
1.0x10
-3
8.0x10
1045 m
1830 m
-3
6.0x10
-3
4.0x10
-3
2.0x10
0.0
0.000
0.001
0.002
0.003
0.004
Cycles per meter
Fig. 6. Shoreline undulation power spectrum estimate (April 1995).
Gravens
7

 Previous Page
