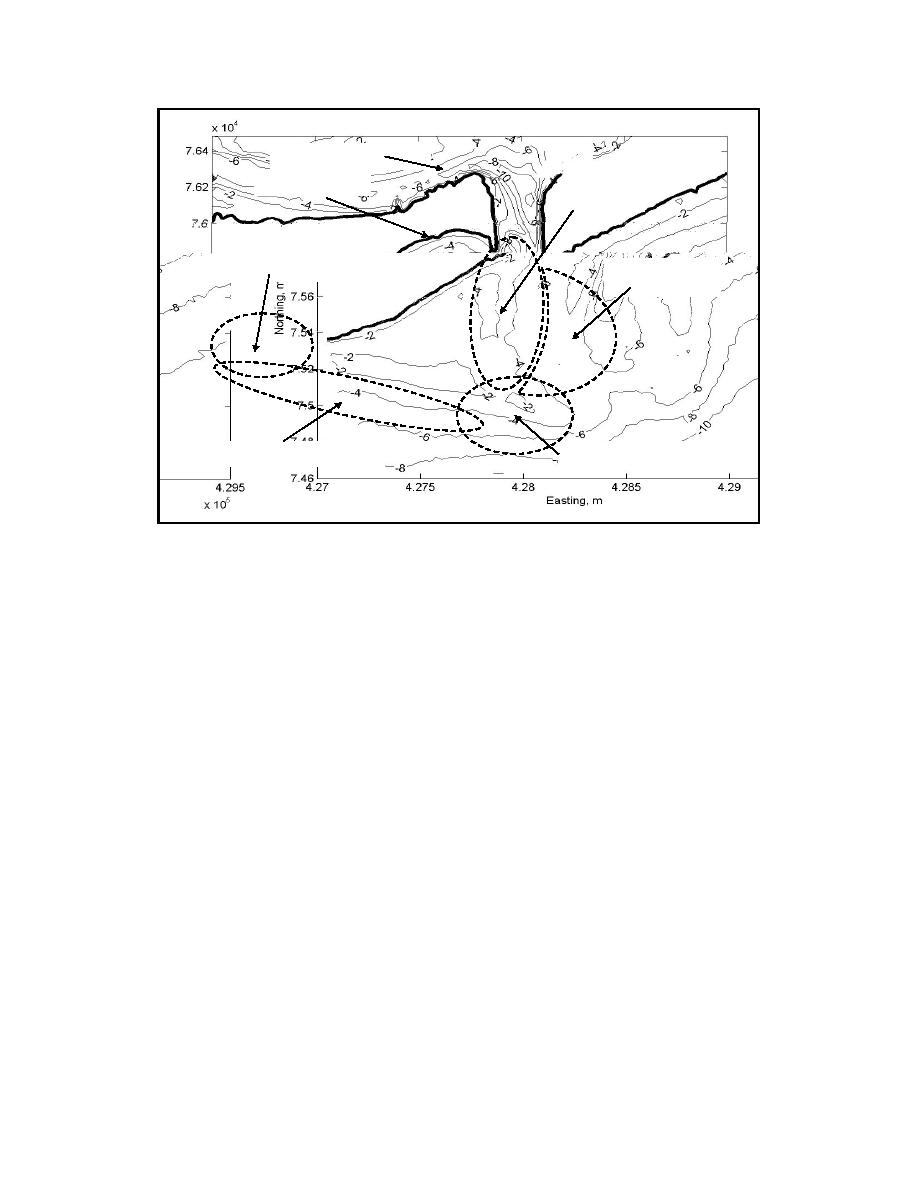
Pressure Gauge
.
Tiana
Tiana Beach
Channel
Attachment
Bar
East Bypass
Bar
West Bypass Bar
Ebb Shoal Proper
Figure 2. 1997 Shinnecock Inlet ebb shoal complex.
Morphology Change Analysis
Predictive relationships have been applied to Shinnecock Inlet to address the
primary processes operating around the inlet and its general stage of development or
evolution. Several investigators have identified a correlation between tidal prism of
an equilibrium inlet and the cross sectional area of the throat (LeConte 1905; O'Brien
1931, 1969; Jarrett 1976). The empirical equation is,
Ac = CP n
(1)
where Ac is the channel cross-sectional area, P is the tidal prism, and C and n are
empirical coefficients. Values of C and n depend on the number of jetties present at
the inlet and the general wave climate. For Shinnecock Inlet the coefficients C and n
are 5.77 x 10⁻⁵ and 0.95 respectively. Application of the Jarrett (1976) equation to
Shinnecock Inlet using the 1998 estimate of tidal prism indicates the minimum cross-
sectional area in the throat of the inlet should approach 2,177 m2 (Buonaiuto 2003b).
A previous estimate gave a minimum inlet cross-sectional area of 2,694 m2 (Militello
and Kraus 2001). These empirically-estimated minimum cross-sectional areas are
larger than those measured in 1994 (1,551 m2) and 1998 (1,566 m2) (Morang 1999).
Between 1994 and 1998 the cross-sectional area of the channel increased, indicating
that the inlet was scouring toward the predicted equilibrium flow area.
The dominant direction of longshore transport along the south shore of Long
Island is from east to west (Taney 1961; Panuzio 1968). Seasonal winds from the
west and southwest in summer can induce short-term transport reversals along the
3


 Previous Page
