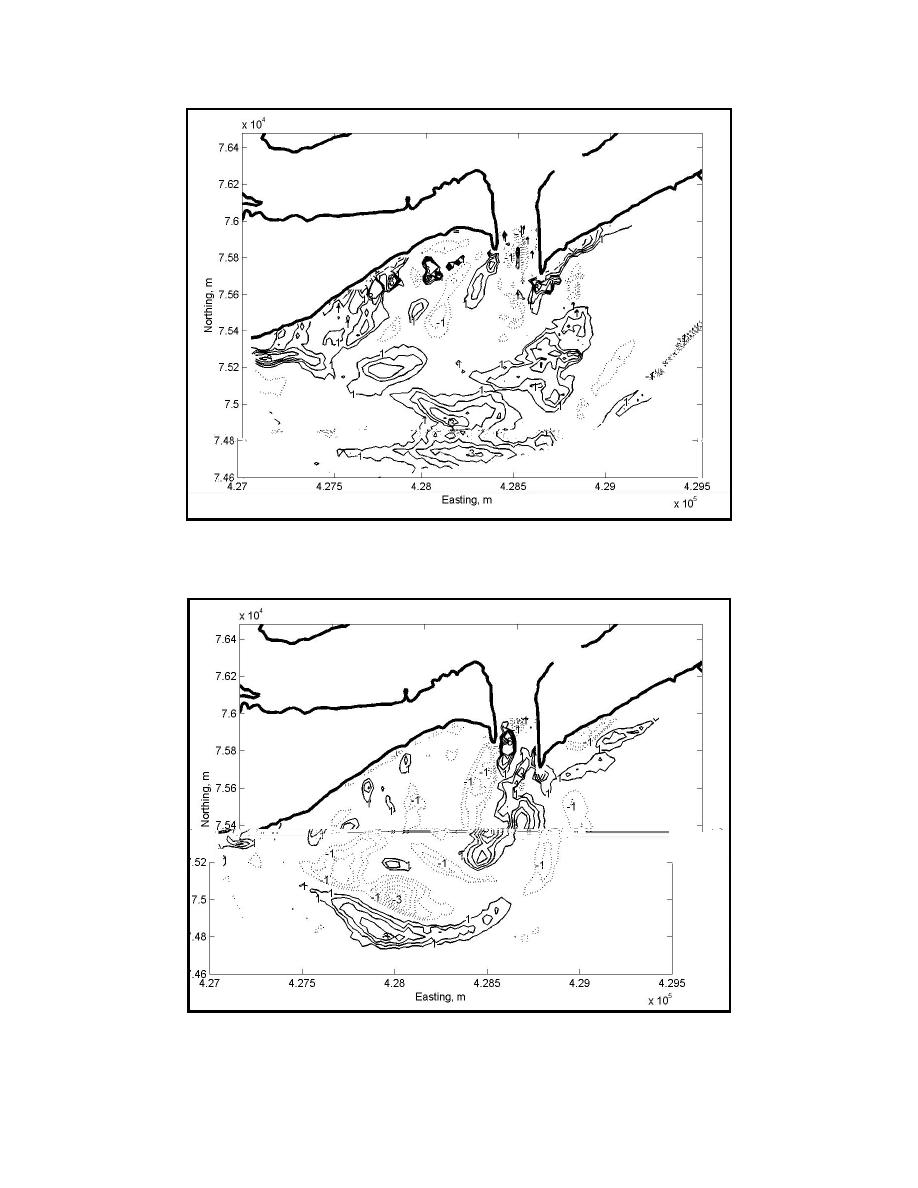
Figure 4. Depth changes between the 1994 and 1997 SHOALS surveys. Contour labels are
in meters. Solid contours indicate areas of accretion and dotted contours mark zones of
erosion.
Figure 5. Depth changes between the 1997 and 1998 SHOALS surveys. Contour labels are
in meters. See Fig. 4 for description.
7


 Previous Page
