January 13, 2004
14:38
WSPC/101-CEJ
00092
Recent Developments in the Geomorphic Investigation
585
F
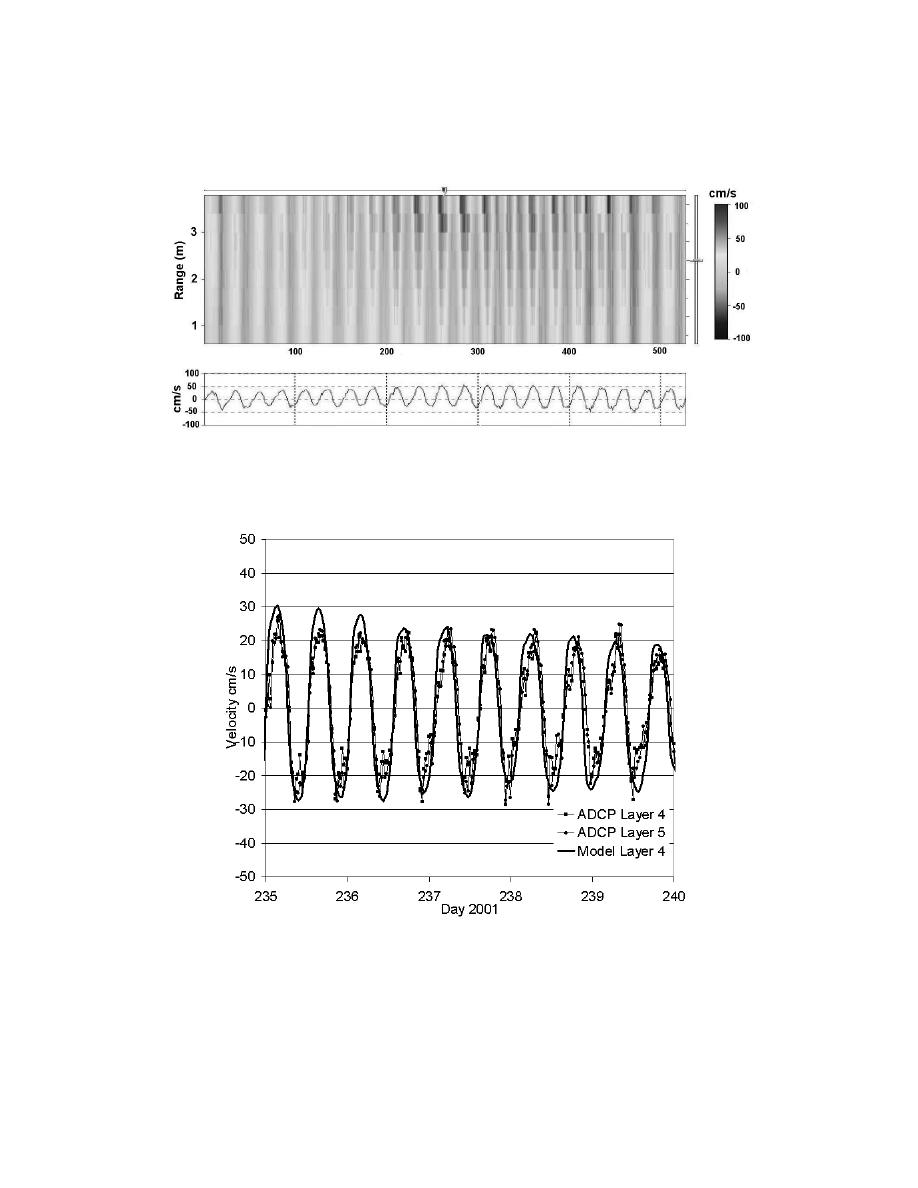
ig. 14. Top panel: ADCP record showing the vertical distribution of velocity over 5 bins. Bottom
panel: Depth average velocity across 5 bins. Positive values indicate north-directed flow and negative
values indicate south-directed flow.
Fig. 15. Comparison of measured velocity from near surface ADCP bins with velocity predicted
in a near surface layer of a three-dimensional hydrodynamic model of a shallow estuary (Zarillo,
2002).


 Previous Page
