D
January 13, 2004
14:37
WSPC/101-CEJ
0ys0a9t7r Start of Breach
a0 f e
Fig. 13. Simulation of growth of breach width, Moriches Inlet.
528
N. C. Kraus
7
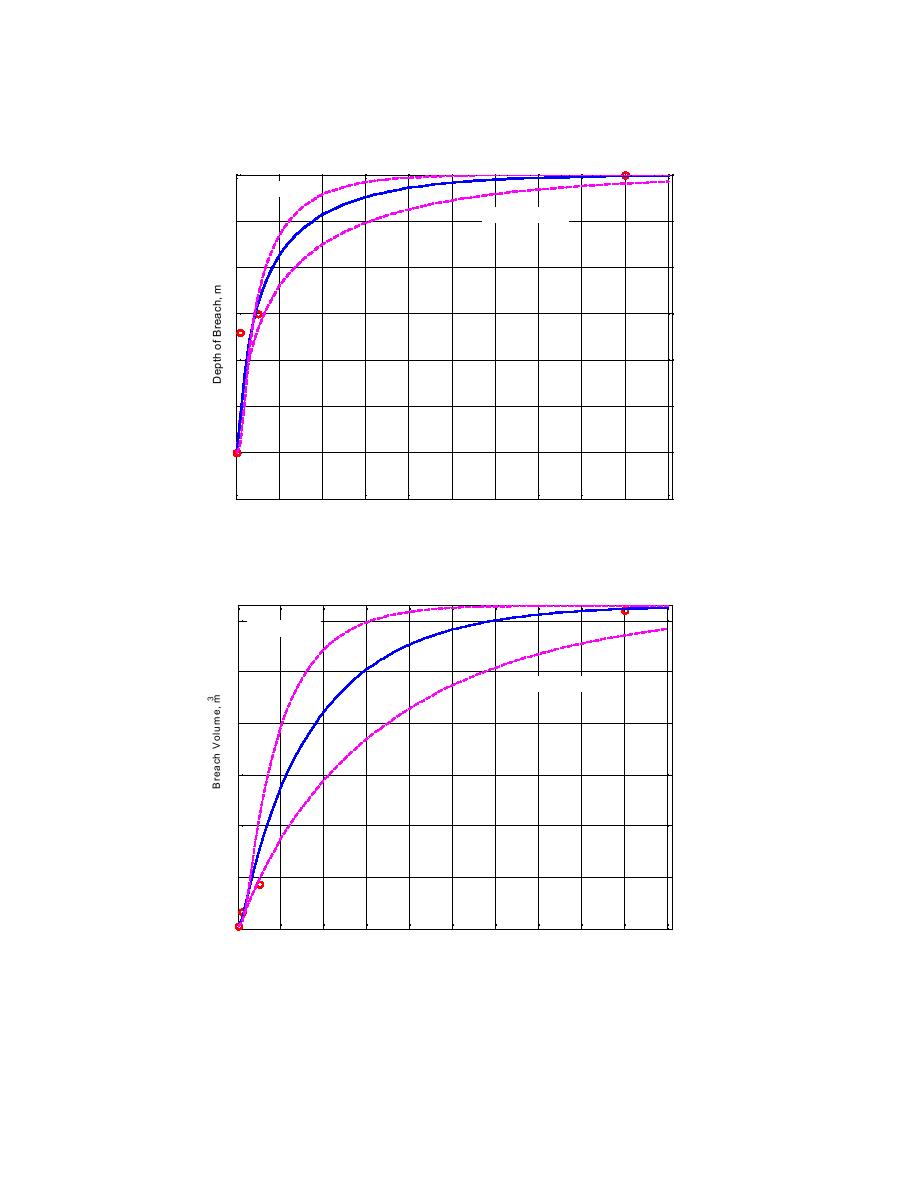
2 x maximum
0. 5 x maximum
6
5
4
3
2
1
0
0
10
20
30
40
50
60
70
80
90
100
Days after Start of Breach
Fig. 14. Simulation of growth of breach depth, Moriches Inlet.
5
x 10
Fig. 14. Simulation of growth of breach depth, Moriches Inlet.
6
2 x maximum
28
5
0. 5 x maximum
4
3
2
1
0
0
10
20
30
40
50
60
70
80
90
100
Days after Start of Breach
Fig. 15. Simulation of growth of breach volume, Moriches Inlet.
Fig. 15. Simulation of growth of breach volume, Moriches Inlet.


 Previous Page
