January 13, 2004
14:37
WSPC/101-CEJ
00097
527
Analytical Model of Incipient Breaching of Coastal Barriers
breach, for which 900,000 m3 were dredged from the bay and trucked from a quarry
in equal amounts. This volume provides a check for the model.
The breach morphology model was established for the area with the initial di-
mensions as in Table 1. Trial and error readily gave a visual good fit to the data
with base rates of QS = QB = 30, 000 m3/day for the maximum transport rates at
the inception of breaching. Such rates are well within the daily production capacity
of, for example, 0.5- and 0.6-m (20- and 24-inch) diameter dredges operating in shal-
low water (Turner, 1996) and, therefore, are considered readily attainable by storm
surge combined with tidal exchange. To explore sensitivity of the model to variations
in maximum transport rates, the base rates were multiplied by 2 and 0.5 to define
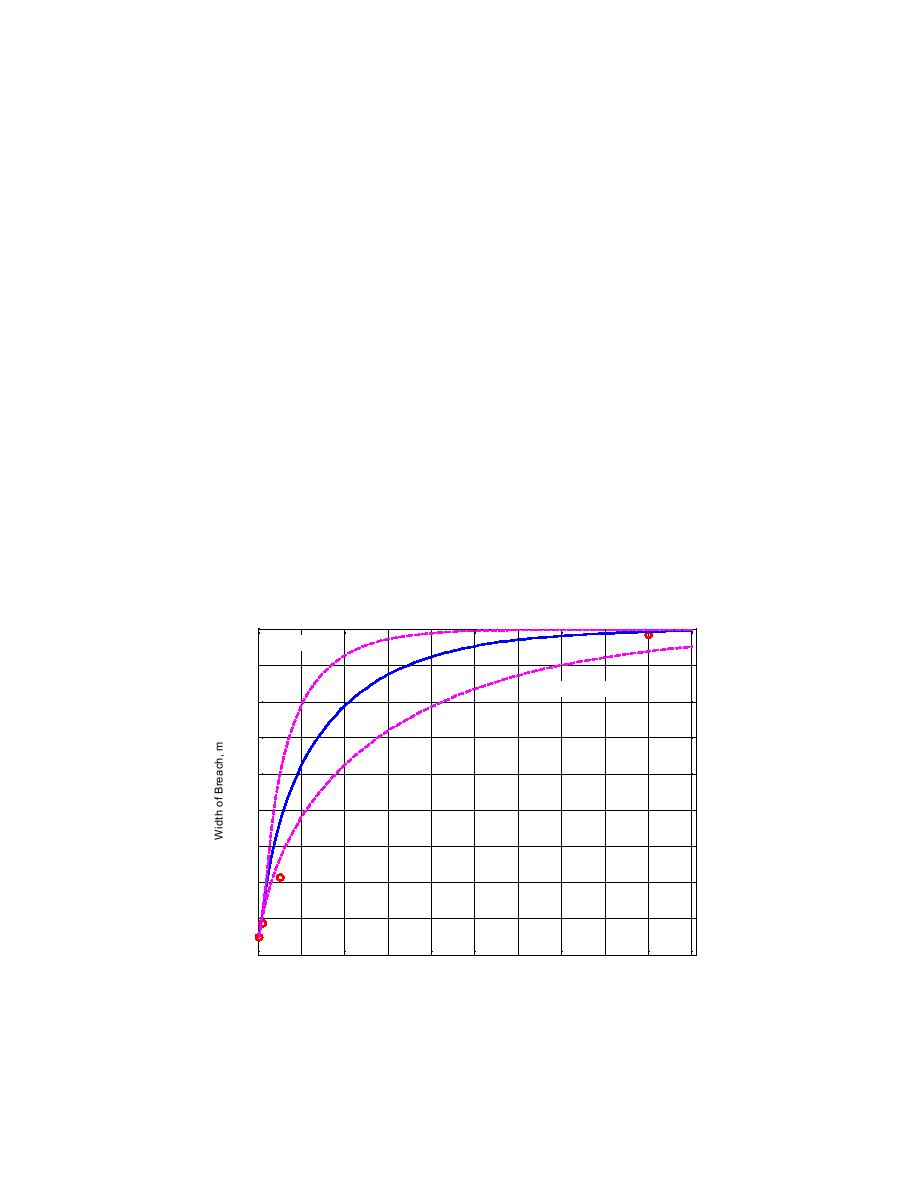
plausible upper and lower bounds, respectively. Figures 1315 plot calculations with
the observed width, depth, and estimated volume of the breach, and the results with
upper and lower limits of assumed maximum transport are depicted with dashed
lines. The volume at different times was estimated from the dimensions as given
in Table 1 and the reported fill volume, assumed to occupy the same approximate
equilibrium volume in May.
The breach morphology model captures the qualitative behavior of the breach
evolution, with rapid initial growth followed by gradual approach to equilibrium.
Width, depth, and volume of the breach are in quantitative agreement with ob-
servations for all available data points through time. Calculations with the lower
estimate of the maximum transport rate deviate more from the observations than
900
2 x maximum
800
0. 5 x maximum
700
600
500
400
300
200
100
0
0
10
20
30
40
50
60
70
80
90
100
Days after Start of Breach
ig. 13. Simulation of growth of breach width, Moriches Inlet.
Fig. 13. Simulation of growth of breach width, Moriches Inlet.
2 x maximum
F
7


 Previous Page
