January 13, 2004
14:37
WSPC/101-CEJ
00097
Fig. 8. Solution of Eq. 4 for breach width, different values of initial breach width.
524
N. C. Kraus
1
1
0.9
0.8
10
0.7
50
0.6
L = 300 m
0.5
100
z0 = 1 m
0.4
3
x0, m
QS = 500 m /day
0.3
3
QB = 1,000 m /day
0.2
ze = 5 m, xe = 300 m
0.1
0
0
100
200
300
400
500
600
700
800
900
1000
Days after Start of Breach
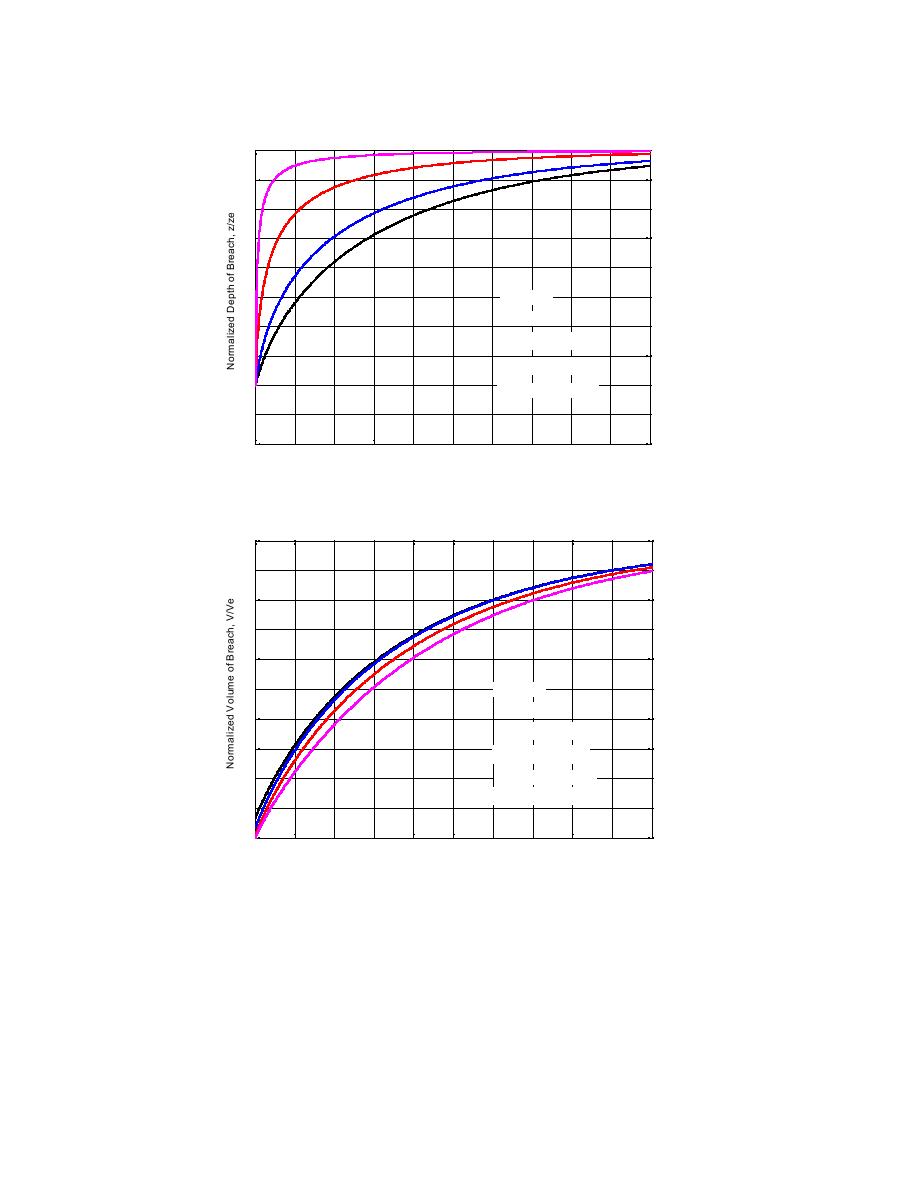
Fig. 9. Solution of Eq. (5) for breach depth, different values of initial breach width.
Fig. 9. Solution of Eq. 5 for breach depth, different values of initial breach width.
1
0.9
24
0.8
x0, m
0.7
100
0.6
1
L = 300 m
0.5
z0 = 1 m
0.4
3
QS = 500 m /day
0.3
3
QB = 1,000 m /day
ze = 5 m, xe = 300 m
0.2
3
Ve = 450,000 m
0.1
0
0
100
200
300
400
500
600
700
800
900
1000
Days after Start of Breach
Fig. 10. Growth of breach volume for fixed initial depth and different initial widths corresponding
to Figs. 8 and 9.
Fig. 10. Growth of breach volume for fixed initial depth and different initial widths
of comparable magnitude, as taken here, then the trends shown are qualitatively
corresponding to Figs. 8 and 9.
correct.
Similar calculations are shown in Figs. 810 for fixed initial depth z0 = 1 m and
initial widths x0 = 1, 10, 50, and 100 m. As expected, breach width approaches


 Previous Page
