7
The M3D model was configured to simulate channel performance for
three channel cross-sections, representing each of the three dredging
requirements described above. Figure 4 shows the offshore footprint of the 55-
ft (16.8 m) deep channel and the cross-sections used for comparisons. The
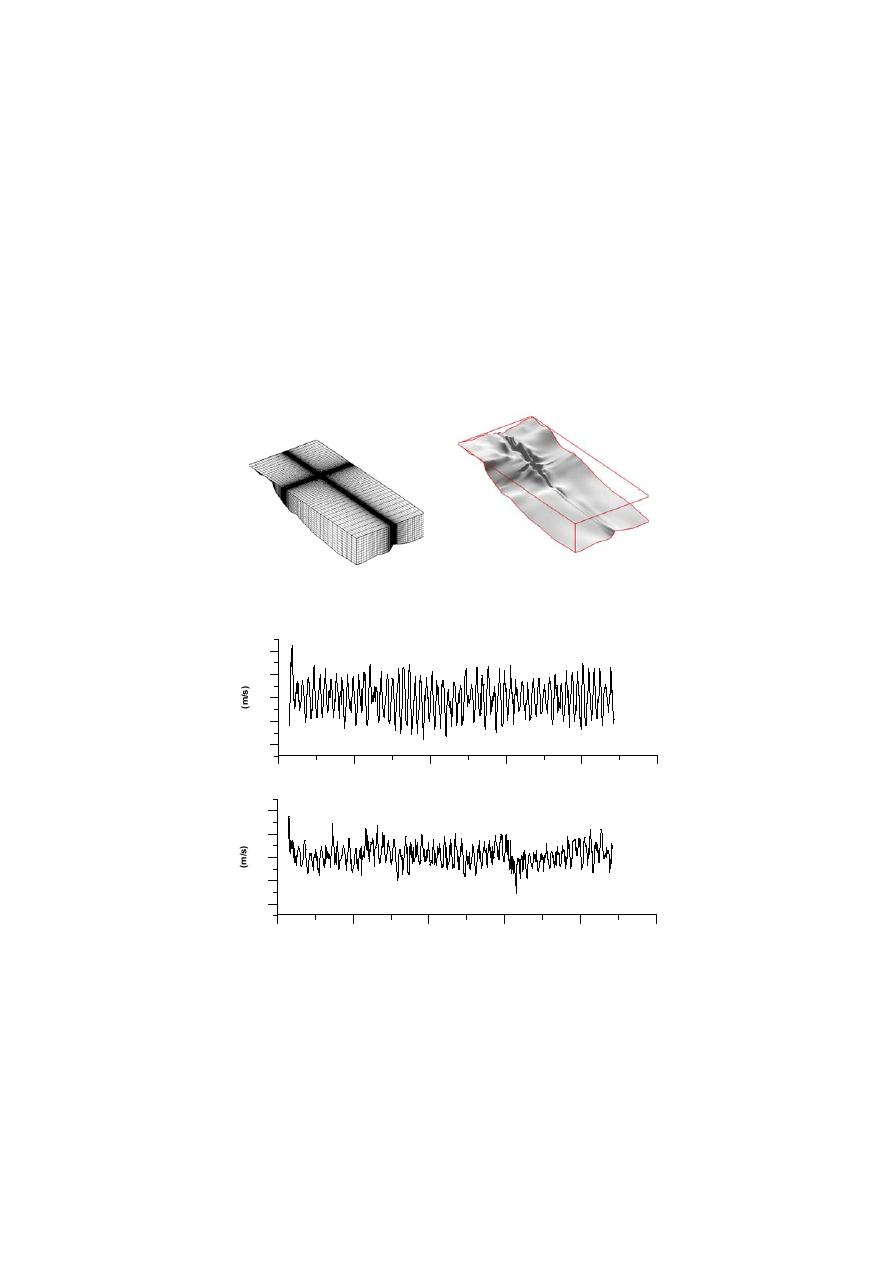
three-dimensional grid and bathymetry are shown in Figure 5. The bathymetric
data were developed by combining data from numerous surveys in the area
conducted during the 1990s. Other data were obtained from the GEODAS
database maintained by the NOAA National Geophysical Data Center.
Figure 5. Area bathymetry and three-dimension numerical grid used in M3D.
alongshore
40
20
0
-20
-40
2/3/00
2/10/00
2/17/00
2/24/00
3/2/00
3/9/00
cross-shore
40
20
0
-20
-40
2/3/00
2/10/00
2/17/00
2/24/00
3/2/00
3/9/00
Figure 6. Example of current data used to force the model simulations.


 Previous Page
