Speed
Flood
Flood
Ebb
m/s
Hr 75
Hr 81
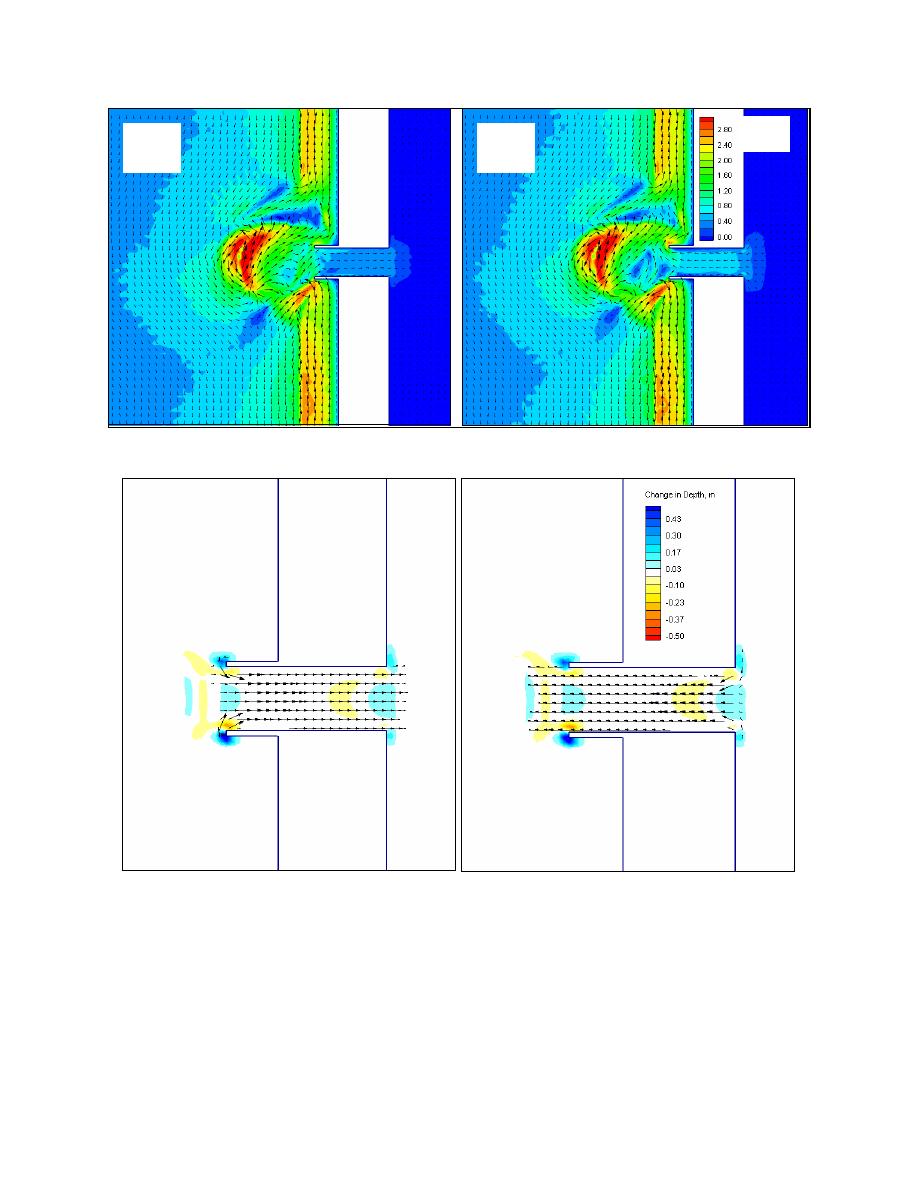
Fig. 9. Current speed and direction, peak flood (hr 75) & peak ebb (hr 81), tide & storm wave
Hr
Hr 75
Hr 81
Fig. 10. Change in depth and transport vectors at hrs 75 and 81, tide only
Case 2: Fair-Weather Wave
Transport vectors and change in depth at hr 99 of the fair-weather wave simulation are shown
in Fig. 11. Sand is impounded against the south jetty, as expected. North of the north jetty,
erosion adjacent to the beach takes place. These morphologic changes indicate successful
representation of morphology change at a beach near a jettied shoreline. Sediment is removed
from the inner portion of the ebb shoal and bypassed. There is also some rearrangement of
Militello and Kraus
9


 Previous Page
