

Case 4: Tide and Fair-Weather Wave
Current speed and direction forced by the tide and fair-weather wave are shown in Fig. 8 for
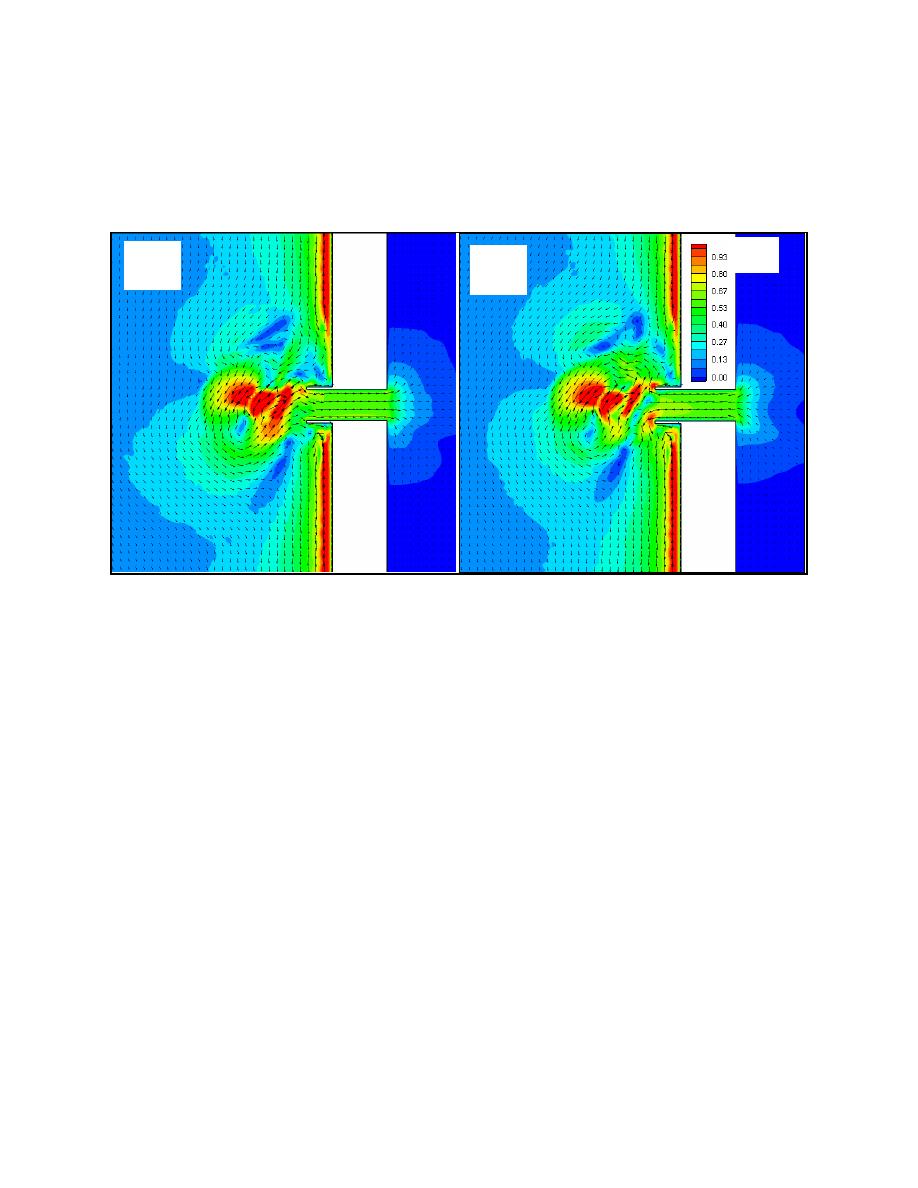
flood and ebb. On the ebb shoal and in the surf zone, the current pattern and speed are similar to
the fair-weather wave-only case. Currents in the inlet exhibit the properties of the tide, including
strong speed at the jetty tips on flood.
Speed
Flood
Ebb,
m/s
Hr 75
Hr 81
Fig. 8. Current speed and direction at peak flood (hr 75) and peak ebb (hr 81), tide and fair-
weather wave
Case 5: Tide and Storm Wave
Current speed and direction for the situation of tide and storm waves are shown in Fig. 9 for
flood and ebb. Current strength and pattern closely follow that of the storm-only currents,
indicating the dominance of the waves. The inlet does exhibit tidal flow that increases the speed
inside the inlet and between the jetty tips on both flood and ebb, as compared to the wave only
case.
SEDIMENT PATHWAYS AND MORPHOLOGY CHANGE
Sediment transport rate vectors and morphology change are discussed for the five
simulations. Contours show change in depth, with blue denoting increased depth (erosion) and
yellow/red denoting decreased depth (accretion). Contour scales vary between the plots.
Case 1: Tide Only
Change in depth and transport vectors for the tide-only simulation are shown in Fig. 10
during flood and ebb. Maximum change takes place at the jetty tips where 0.5 m of erosion
occurs. Erosion also takes place at the inlet entrances on both ocean and bay sides. Tip shoals
form near the seaward end of the jetties. These changes in morphology replicate those that occur
in nature and indicate that the sediment transport component of the modeling is realistic. No
significant sediment bypassing occurs across the ebb shoal, and sediment enters the channel from
both sides during flood tide, from where it can move to the ebb shoal and flood shoal.
Militello and Kraus
8

 Previous Page
