

Tide forcing for the circulation model was represented as a sine wave having amplitude of
0.5 m and period of 12.42 hr. For simulations in which no tide forcing was applied, the water-
surface elevation at the offshore boundary was set constant to 0 m. Wave height and period were
representative of fair-weather and storm conditions, and a narrow spectrum was specified. A
time step of 1 s was applied for all circulation model simulations and model forcing was spun up
for duration of 1 day with a hyperbolic tangent ramp function. Simulation duration was 99 hr.
HYDRODYNAMIC PROPERTIES
Current and wave fields for the five simulations are presented. Results from simulations with
tidal forcing are shown at peak flood (hr 75) and peak ebb (hr 81). Results from simulations
with wave-forcing only show the current field at the end of the simulation (hr 99). Contour
scales for the velocity plots vary for each case to best represent the range of speeds calculated.
Case 1: Tide Only
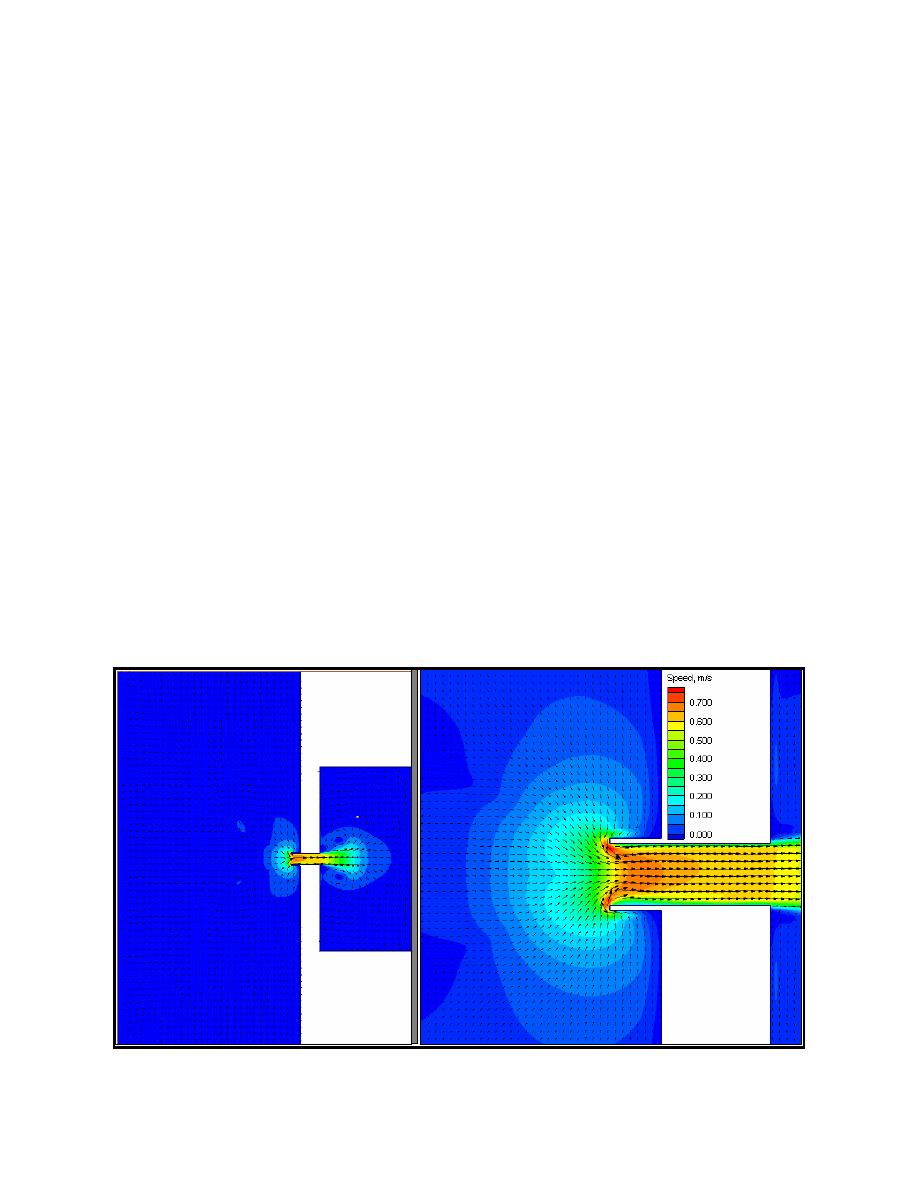
Current speed and direction at peak flood and peak ebb for forcing by tide alone are shown in
panel A on the left, and detail at the ebb shoal and inlet is shown in panel B on the right. During
flood, the strongest currents, reaching 0.9 m/s are located directly adjacent to the jetty tips.
Inside the inlet, the strongest current speed is 0.65 m/s. On ebb, the maximum current speed is
0.71 m/s and occurs inside the inlet. The ebb shoal deflects the ebb current, splitting the jet.
Maximum current speed over the shallowest portion of the ebb shoal is 0.3 m/s.
Case 2: Fair-Weather Wave
Wave height and direction for the fair-weather wave case are shown in Fig. 4. Strong
refraction, wave shoaling, and breaking occur at and near the ebb shoal. Wave height ranges
from 1 m at the seaward boundary to 1.8 m on the northeast edge of the ebb shoal.
A
B
Fig. 2. Current speed and direction, peak flood (hr 75), tide only
Militello and Kraus
4

 Previous Page
