January 13, 2004
14:36
WSPC/101-CEJ
00094
556
W. C. Seabergh & N. C. Kraus
4.2.2. Spur elevation
Spur elevation might be expected to be similar to the jetty to which it is attached.
Dependent on wave climate, the spur can serve as a fishing platform if access is
provided. The Fort Pierce spur provides an asphalt walkway. A long submerged
spur has been proposed at Grays Harbor, Washington (Kraus and Arden, 2003). A
reef-type spur was examined in the laboratory (discussed below) and may provide
similar benefits as a surface-piercing spur, yet be less costly.
4.2.3. Spur length
A spur should be long enough to promote a diversion of flow from along the jetty
to keep sediment in the nearshore area rather than move offshore towards the jetty
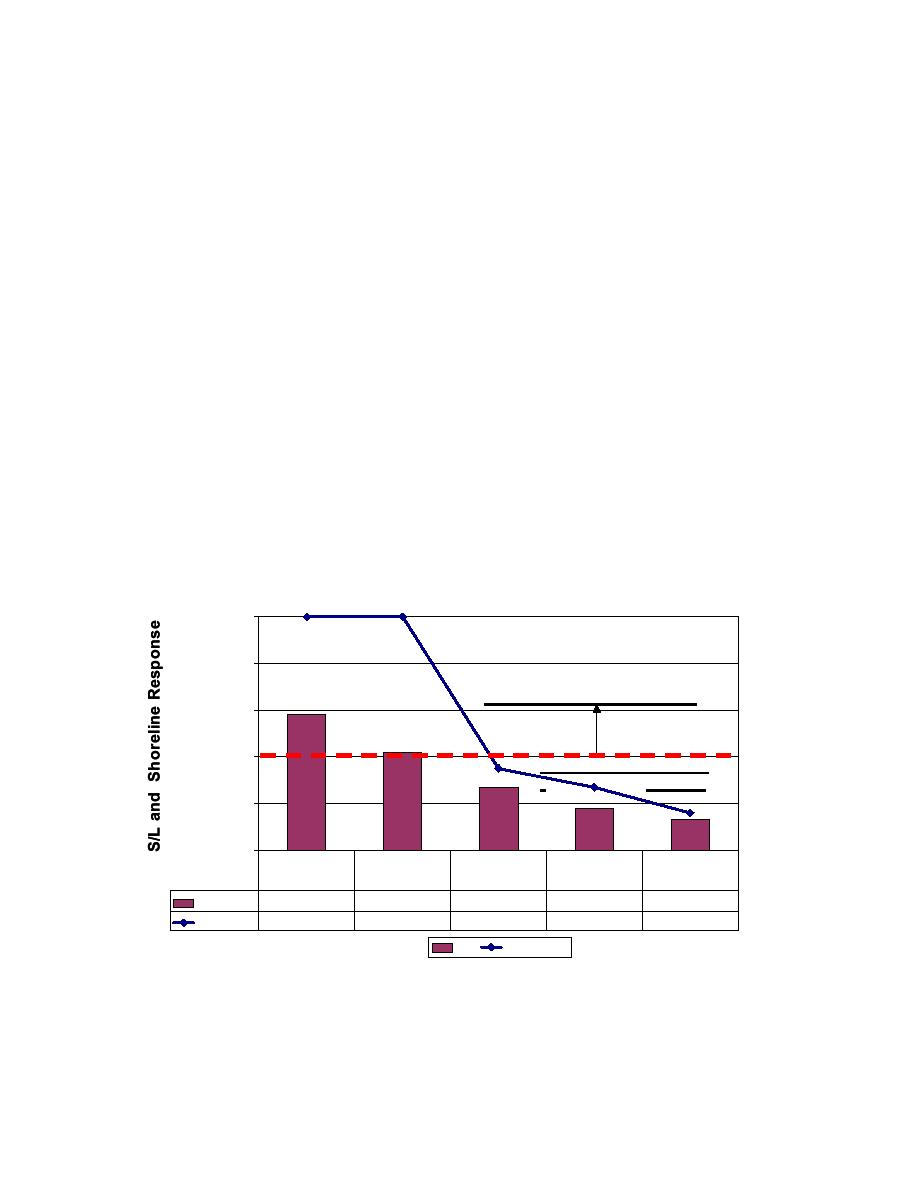
tip. Some physical model results shown below will illustrate this. Field data from
Table 2 were consulted to compose the plot in Fig. 14. An S/L ratio (S is spur
length and L is distance from spur to the local average shoreline) is plotted for each
field site. A shoreline response ratio was determined from the ratio of distance from
the local average shoreline to the shoreline at the jetty divided by the distance from
local average shoreline to the spur. Therefore, a shoreline response of 1.0 means the
shoreline has reached the spur. This is seen for Bakers Haulover and Shark River,
with S/L ratios greater than 0.4. The others have S/L less than 0.4 and shoreline
responses much less than 1.0.
1
0.8
Full shoreline response, S/L> 0.4
0.6
0.4
Partial shoreline response
S/L<0.40
0.2
0
Bakers
Siuslaw River-
Siuslaw River-
Shark River
Fort Pierce
Haulover
north
south
0.58
0.42
0.27
0.18
0.13
S/L
1
1
0.35
0.27
0.16
Response
S/L
Response
Fig. 14. Structure length (L) to distance from spur to local average shoreline (L) ratio plotted with
the shoreline response, which is the ratio of (a) distance from the local average shoreline to the
Figmmedi4. e Shrucltiurealetngtjet(tL)too b)istiatace efroom socarl to elrocalsavrerlagetohoreslpne. (L) ratio
i ure 1 at st ore ne t he h y t ( d d sn nc fr m lpu av age ho e ine s the i ur
plotted with the shoreline response, which is the ratio of (a) distance from the local average
shoreline to the immediate shoreline at the jetty to (b) distance from local average shoreline
to the spur.


 Previous Page
