

0.12
0.08
0.04
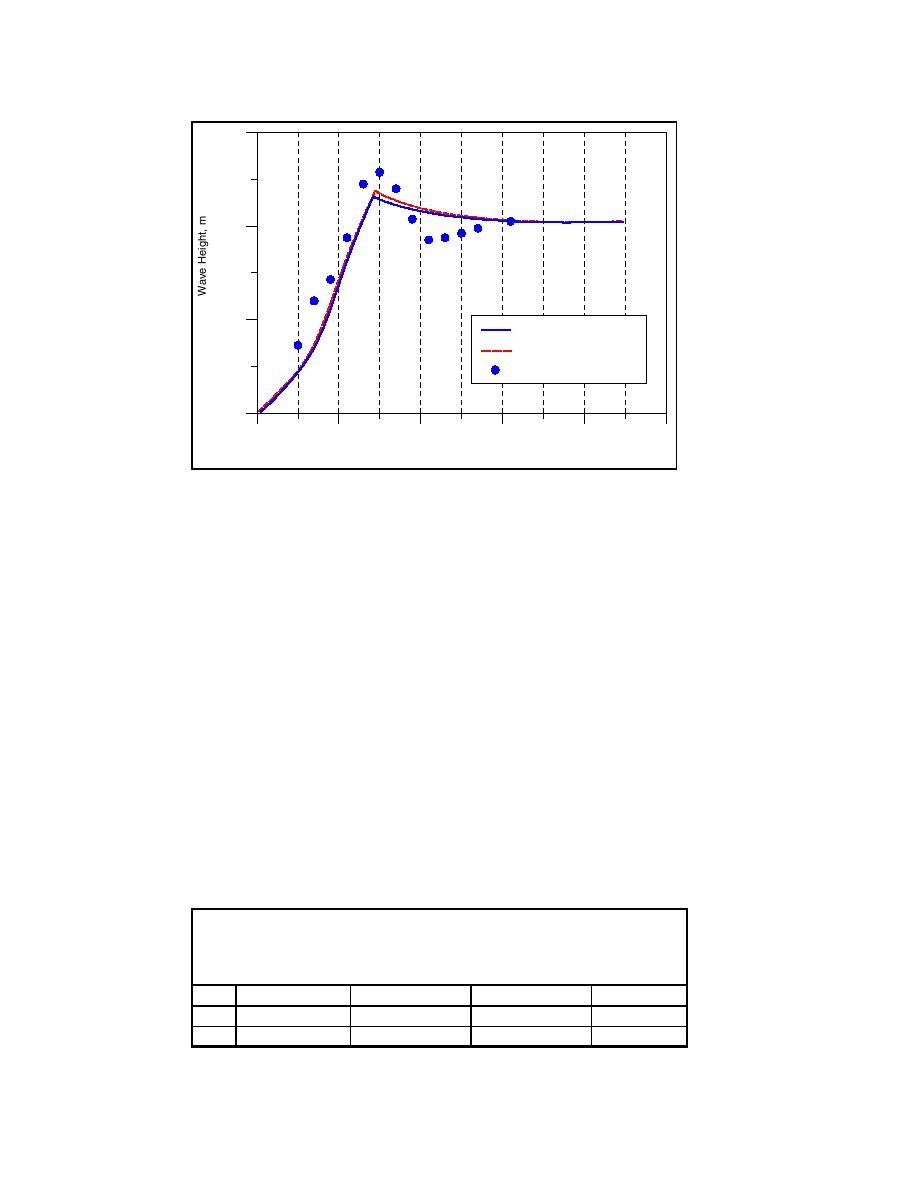
Calc. with c-w interaction
Calc. without c-w interaction
Measured
0.00
0
1
2
3
4
5
Distance Across Shore, m
Figure 32. Calculated (with and without interaction between current and
waves) and measured wave height for Visser (1982), Case 1
CHL-L Data
Hamilton and Ebersole (2001) investigated methods for establishing a
uniform mean longshore current distribution, as driven by obliquely incident
waves, along the shore in a large laboratory basing recently installed at the
U.S. Army Engineer Research and Development Center (ERDC), Coastal and
Hydraulics Laboratory (CHL), (this data set is referred to as the CHL-L data
here). Two comprehensive test series were conducted on a plane concrete
beach with straight and parallel contours (1:30 slope down to horizontal
bottom) encompassing monochromatic and random waves. Wave height,
mean water level, and longshore current velocity were measured along
several profile transects. For evaluating NMLong-CW, one monochromatic
and one random test were available from the experiments.
Table 5 summarizes the wave conditions for the two tests (Tests 6N and
8E). Hamilton and Ebersole (2001) tabulated the measured data in an
appendix, and the average values over several transects were considered for
model validation in the present study. The water depth in the horizontal
portion of the basin was 0.667 m, and for Test 8E it is the energy-based
significant wave height and peak spectral period that are given in the table.
Table 5
Wave Conditions in the Horizontal Portion of Basin for Two
Tests from Hamilton and Ebersole (2001) Experiments Used in
NMLong-CW Simulations
Test
Wave Height (m)
Wave Period (s)
Wave Angle (deg)
Comment
6N
0.182
2.5
10
Monochromatic
8E
0.225
2.5
10
Random waves
54
Chapter 6 Verification of Longshore Current Model

 Previous Page
