

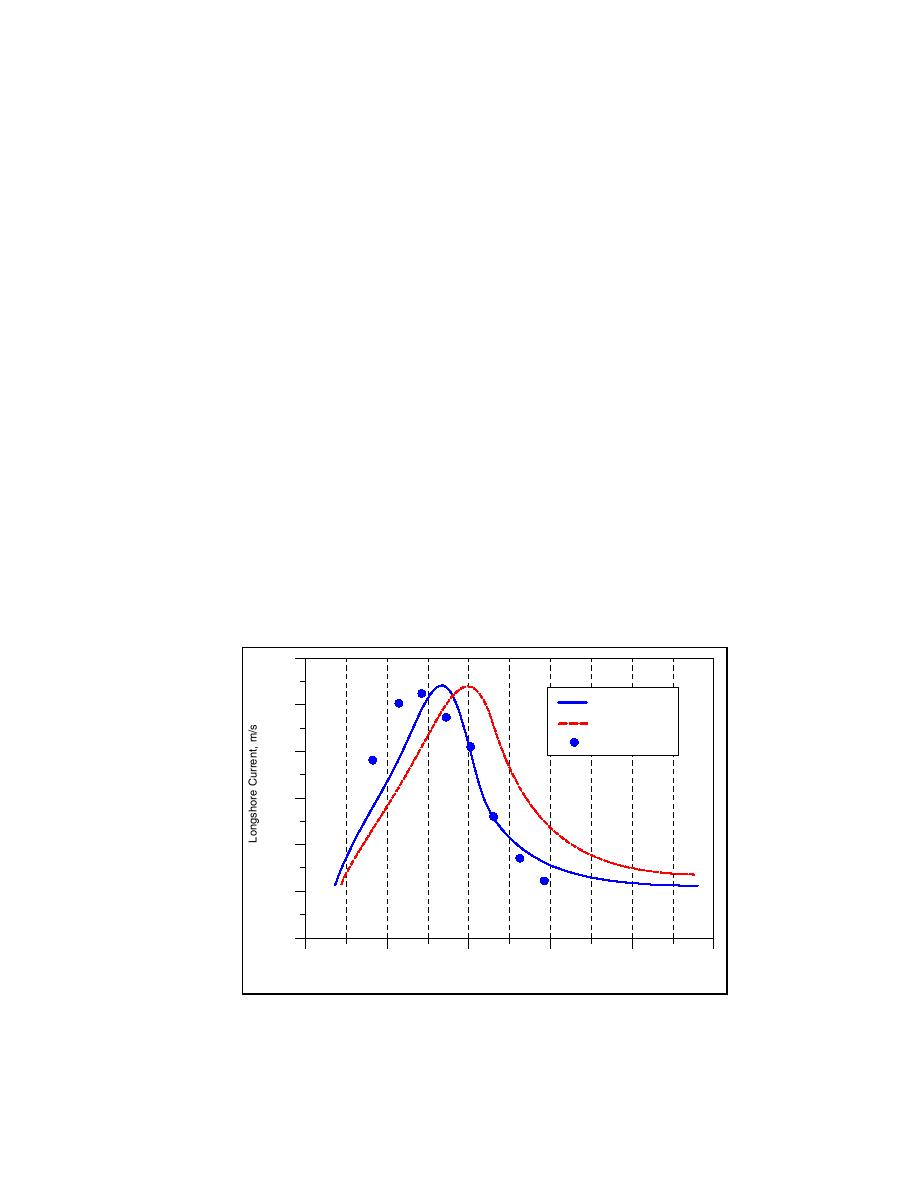
Figures 33, 34, and 35 illustrate the calculation results with NMLong-
CW for the longshore current, mean water level, and wave height,
respectively, for Test 6N. Calculations were performed with and without the
roller model, and standard values were assigned to all model parameters
set to cf = 0.005 and 0.004, respectively. Again, inclusion of the roller model
causes a shoreward shift of the longshore current distribution that
significantly improves the agreement with the measurements, although the
measured peak in the distribution is still located somewhat inshore of the
computed peak. The shoreward translation of the forcing produced by the
roller model causes a narrowing of the surf zone (i.e., the total forcing acts
over a shorter distance), which in turn implies that cf must be increased
somewhat to achieve optimal agreement with the data.
Agreement with the measured mean water level is also improved by
including the roller model (see Figure 34), but the shoreward shift induced by
the roller is not sufficient, and the measured water level distribution still lies
shoreward of the predicted one. Another discrepancy is the maximum
setdown, which is larger in the measurements than calculated. The smaller
calculated value might be related to nonlinear shoaling, which is not taken
into account in NMLong-CW, causing an increase in the wave height prior to
incipient breaking. The comparison between the calculated and measured
wave height supports this assumption, because the wave height is
underestimated during the final portion of the shoaling directly before
incipient breaking (Figure 35). Modifying the ratio γb might improve
agreement for the wave height, also modifying the current and mean water
level distributions. However, the primary objective here was to validate the
model with standard values assigned to the different model parameters and
allow only cf to vary in comparing calculations and measurements.
0.5
Calc. with roller
0.4
Calc. without roller
Measured
0.3
0.2
0.1
0.0
-0.1
0
5
10
15
20
25
Distance Across Shore, m
Figure 33. Calculated (with and without roller model) and measured
longshore current for Hamilton and Ebersole (2001), Test 6N
55
Chapter 6 Verification of Longshore Current Model

 Previous Page
