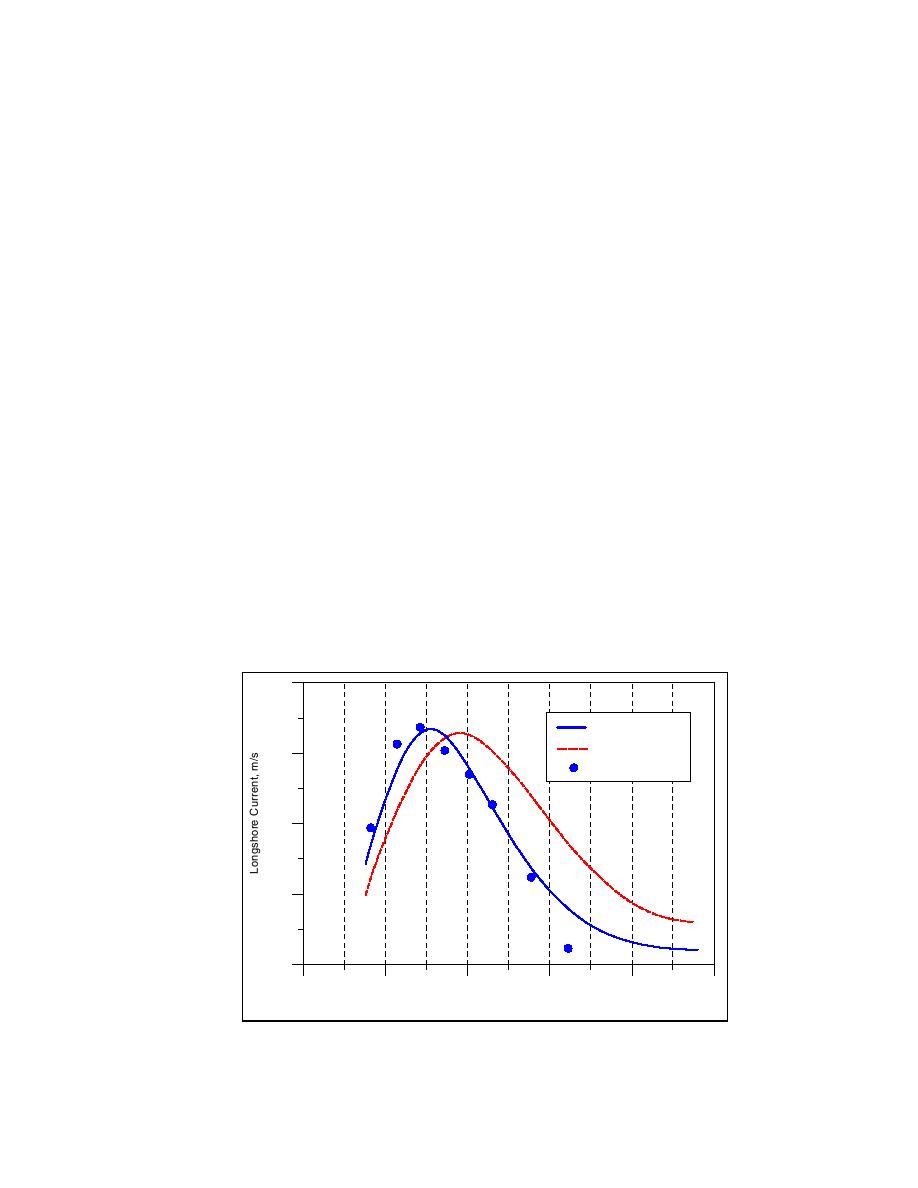
Figures 36, 37, and 38 show the calculated and measured distributions of
the longshore current, mean water level, and wave height, respectively, for
Test 8E, which involved random waves. The same friction coefficient values
were applied as for Test 6N, and a Rayleigh pdf was assumed to describe the
random properties of the wave height in the horizontal portion of the basin
(wave period and incident wave angle were held fixed during the Monte-
Carlo simulations). The agreement between the measured and calculated
current distribution improved somewhat compared to the monochromatic test,
and functioning of the roller model is necessary for obtaining satisfactory
simulation results. At the seaward end, the calculated current tails off with a
smaller slope than what the measurements seem to indicate. Thus, the
mixing formulation appears to somewhat overestimate the lateral momentum
exchange in deeper water, which is also indicated in the simulations of Test
6N (Figure 33).
Similar to the calculations for the monochromatic test, the computed
mean water level distribution is located more seaward than the measured
distribution, and the maximum setdown is underestimated (Figure 37).
Again, the underestimation might be related to nonlinear wave shoaling, not
represented in NMLong-CW, although it is not as easily seen in the wave
height distribution as for Test 6N because the statistical wave height
computed tends to smooth the action of individual waves. Figure 38 shows
the agreement between the calculated and measured (significant) wave
heights, and some discrepancy is observed. The discrepancy is attributed
primarily to differences arising from the calculated and reported wave
heights: the calculated wave height is the significant value determined from
the mean of the one-third highest waves, whereas the measured wave height
is the energy-based significant height derived from the spectrum. The
measured height includes the long-periodic motion in shallow water, which is
often filtered before the wave height is computed.
0.4
Calc. with roller
Calc. without roller
0.3
Measured
0.2
0.1
0.0
0
5
10
15
20
25
Distance Across Shore, m
Figure 36. Calculated (with and without roller model) and measured
longshore current for Hamilton and Ebersole (2001), Test 8E
57
Chapter 6 Verification of Longshore Current Model


 Previous Page
