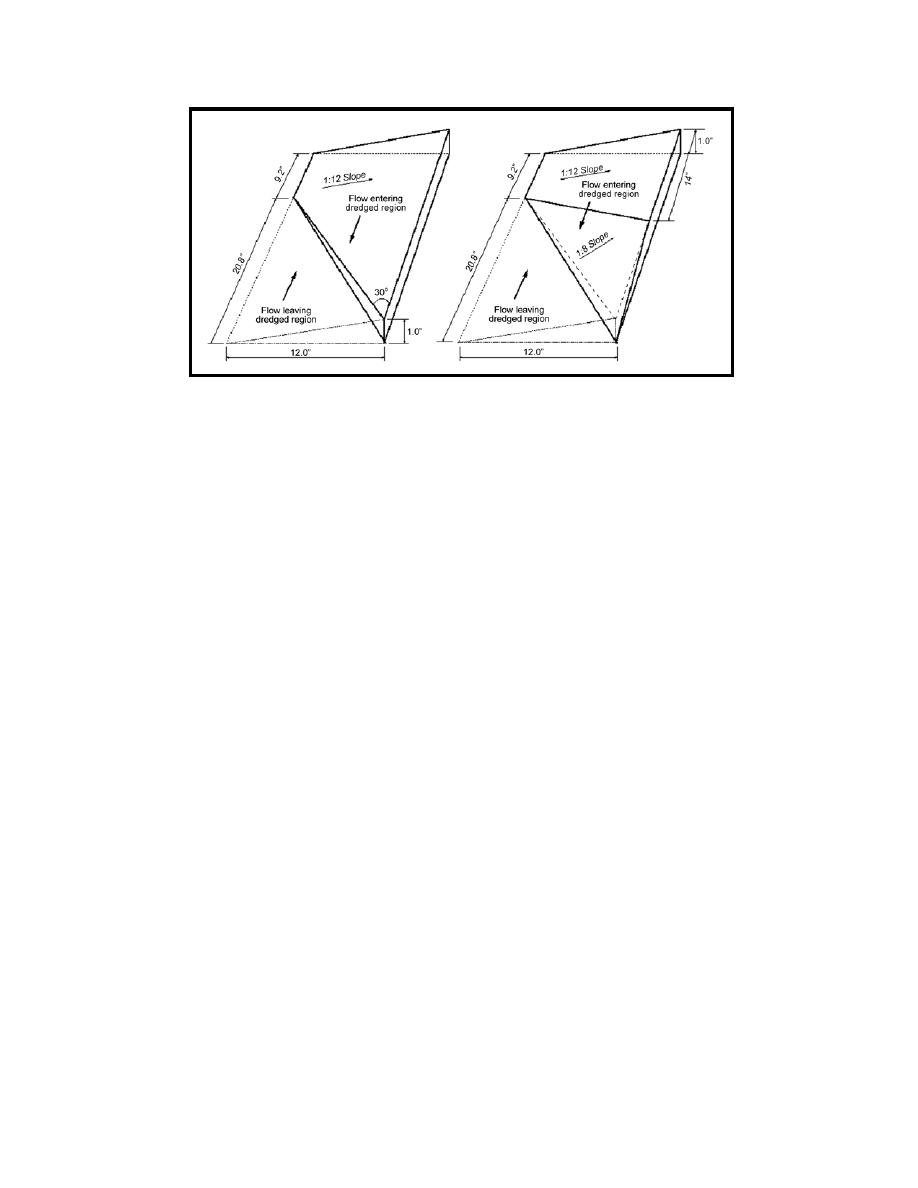
Figure 51. Dredge transition planform configurations
Dredge Transition Test Results
Flow leaving dredged area
The first case tested was flow leaving the deeper dredged area and passing
over the transition. Measured velocity vectors in the dredged area adjacent to the
dredge transition are shown in Figure 52 for the vertical transition and Figure 53
for the sloping transition.
For the vertical dredge transition, the vertical distance was highest at the
lower right side of Figure 52, and here the middepth velocity vectors aligned with
the transition and increased slightly in magnitude. This vector realignment
lessened as the height of the vertical step decreased. However, the effect of the
vertical transition was mainly in redirecting the flow; velocity magnitudes were
not appreciably decreased, and this lowered the suspended sediment deposition
potential.
The flow pattern was only slightly different in the case of a sloping transition
as shown by the vectors in Figure 53. The vectors were more uniform at mid-
depth because of a smoother transition to the shallower region, and deposition
potential was even less than for the vertical transition.
Flow entering dredged area
The dredge transition pieces were reversed in the flow table to simulate tidal
flow entering the dredged area. Measured velocity vectors in the area to the lee
of the dredge transition are shown in Figure 54 for the vertical transition and
Figure 55 for the sloping transition.
As water flows over the vertical transition, flow separation occurs at the step
which creates a region of turbulence in the immediate lee of the step. This is
weakly illustrated by Figure 54, where flow is from the bottom to top in the
figure. Dye injection upstream of the vertical transition revealed a helical flow
69
Chapter 6 Impact of Dredging Planform


 Previous Page
