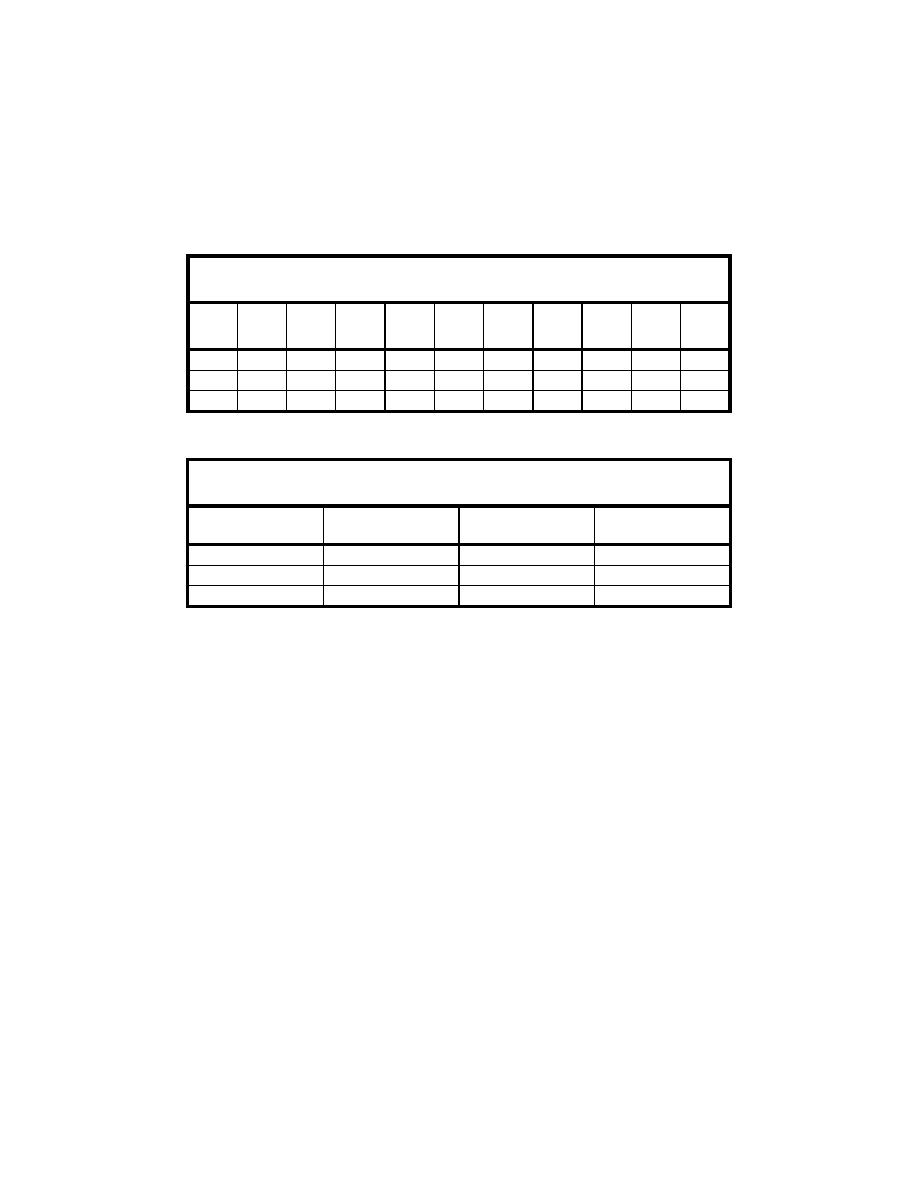
Table 7 lists the scale factors used in the Case 4 tests, along with values of
discharge and key horizontal (Xp, Xm) and vertical (Zp, Zm) dimensions. The X and
Z dimensions refer to the flow gap and water depth, respectively. Five horizontal
measurement transects were collected at different depths for each experiment.
Measurement depths and horizontal line spacings are listed in Table 8. Only the
flow rate of Q = 1.5 L/sec was tested.
Table 7
Distortion in Vertical Step Experiment
Qp
Qm
Xp
Xm
Zp
Zm
NX/NZ
NQ
NX
NZ
Tests
(L/sec)
(L/sec)
(mm)
(mm)
(mm)
(mm)
1
1
1.0
1.000
1.000
1.5
1.5
300
300
37
37
2
3
1.0
1.933
0.644
1.5
1.5
300
155
37
58
3
6
1.0
2.930
0.488
1.5
1.5
300
102
37
77
Table 8
Measurement Geometry of Case 4 Vertical Step Experiment
∆y
Measurement Depth
NX/NZ
(mm)
(mm above bottom)
Tests
1
1
5
3, 7, 12, 18, 27, 35
2
3
2.6
5, 11, 18, 30, 43
3
6
1.7
6, 14, 25, 38, 54
Case 4 results
Comparison between the prototype and models with distortion equal to 3 and
6 are displayed in Figure 49. The figure presents a cross section along the flow
center line with flow moving from left to right. The vertical step is drawn on the
lower left of the figure, and the plot dimensions are those of the prototype. The
magnitudes of horizontal velocities measured along the transect lines at each
depth are represented by a vertical distance. Prototype magnitudes are given as
vertical lines, whereas the distorted model magnitudes (scaled up to prototype)
are shown as lines connecting points. No comparisons were available for the
prototype transect closest to the free surface.
In the nonturbulent flow region above the vertical step, comparisons are
judged to be very good. Note, however, at elevation of 27 mm (1.06 in.)the
prototype horizontal velocity magnitudes showed a gradual decrease with
increasing distance downstream. This decrease was not evident in the distorted
models. Because similar prototype decrease did not occur at other depths, it was
concluded that the prototype measurements at the 27-mm (1.06-in.) elevation
probably contained some time-dependent measurement error such as drift of the
voltage offset level.
64
Chapter 5 Turbulence Scale Effects Experiments


 Previous Page
