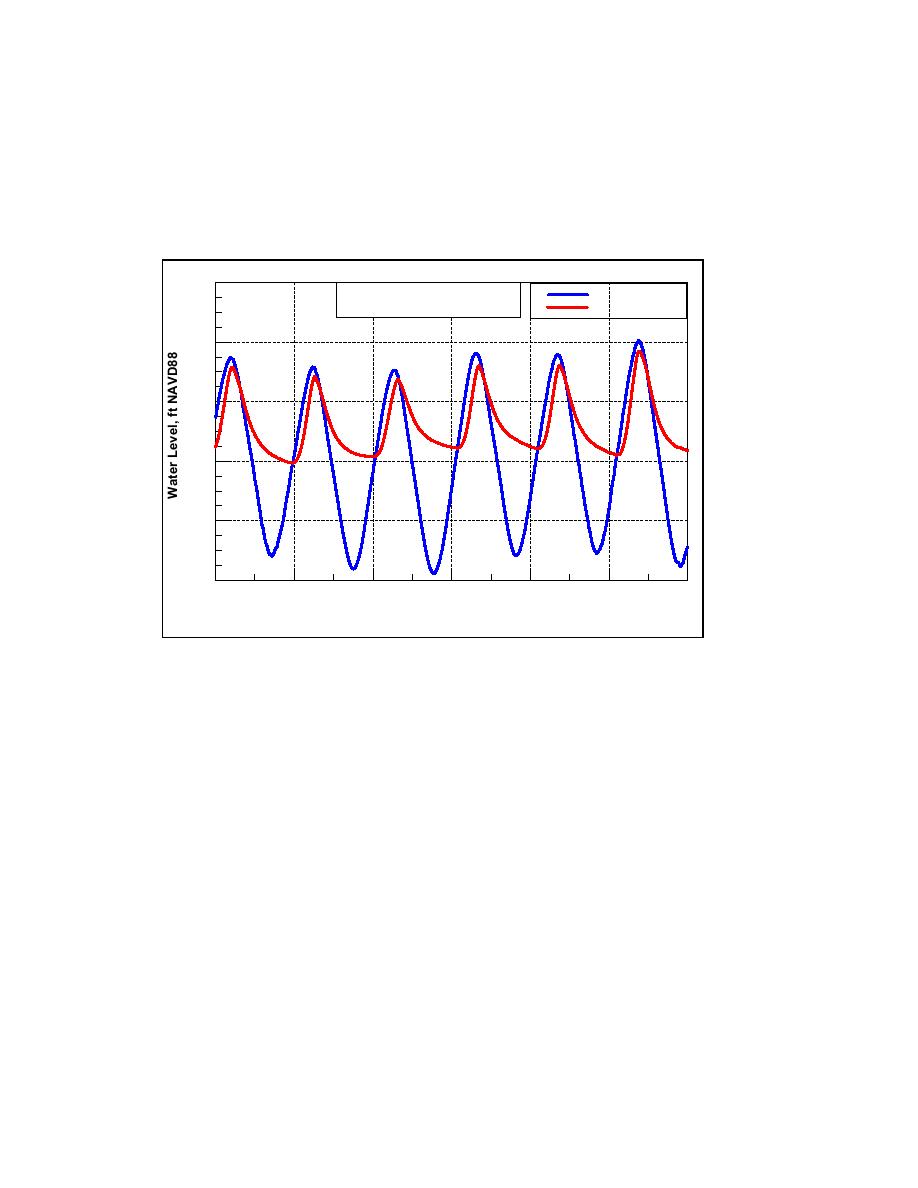
Figure 3-47b plots water levels for 57 October 2002, a period of spring tide, and
illustrates the phase lag observed at Goldsmith Inlet. Because the tidal wave travels from
east to west in Long Island Sound, the phase of the tide at Goldsmith Inlet, located
5.2 miles east of Mattituck Inlet will slightly lead that outside of Mattituck Inlet.
Therefore, the calculated phase lags for Goldsmith Inlet are slightly less than the values
given.
6
Mattituck Offshore and
Mattituck Jetty
Goldsmith Pond Water Level
Goldsmith Pond
4
2
0
-2
-4
10/5
10/7
10/8
10/6
5- 7 October 2002 GMT
Figure 3-47b. Goldsmith Inlet water level, 57 October 2002
The times series of water level in Goldsmith Pond, as shown in Figure 3-47a and
more clearly in Figure 3-47b, exhibits three remarkable properties:
a. Low tide usually does not reach 0 NAVD88, which is approximately msl at the
site.
b. The tide range in the pond is less than half that in the Long Island Sound.
c. Water level rises much more rapidly than it falls, and the duration of ebb is much
longer than flood.
Properties (a) and (b) are related. In Goldsmith Pond, the duration of the average ebb
tide (peak to trough) of record was 8 hr, 56 min, and the duration of the average flood
tide (trough to peak) was 3 hr, 28 min.
The bottom of the mouth of Goldsmith Inlet is located approximately at the elevation
of the NAVD88 datum, near the visually observed mean shoreline position. The relation
between NAVD88 and msl at the mouth of Goldsmith Inlet is not known with
confidence. In any case, flow into the inlet and pond can only occur if the water level in
Long Island Sound is above the NAVD88 or msl datums, according to modeling results
described in Chapter 5. When high tide is reached in the sound, high tide in the pond
occurs about 29 min later (median lag) and is 0.25 ft lower. In contrast, the median phase
90
Chapter 3 Field Data Collection and Analysis


 Previous Page
