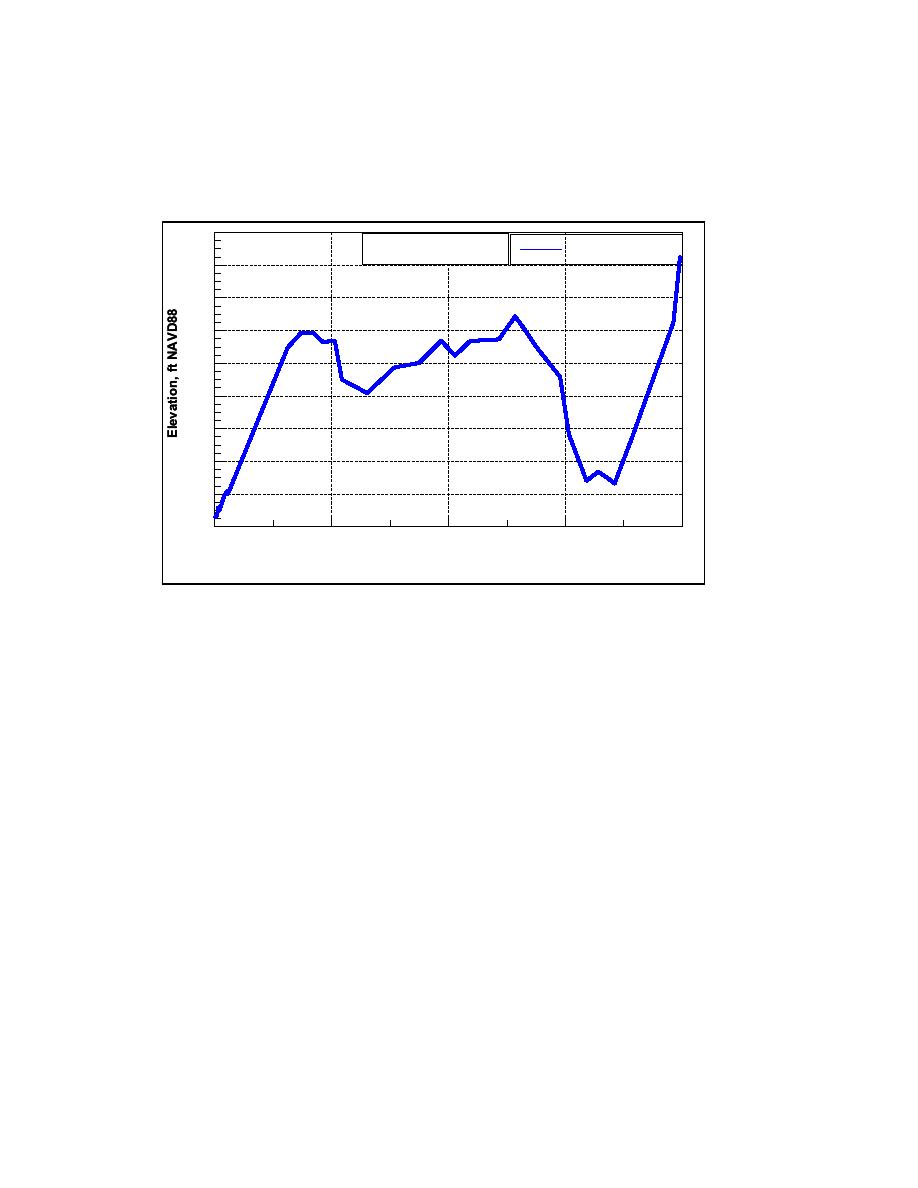
Elevation changes along the channel center line at Goldsmith Inlet are summarized in
Figure 3-45. The entrance, located at the shoreline, presents a sill to tidal flow, as does
the interior of the channel toward the pond. The response of the tidal flow to the sill at
Goldsmith Inlet is discussed in the following paragraphs.
3
Goldsmith Inlet and Pond
Channel Centerline
October 2002
2
1
Flood Shoal
Shoreline
0
Channel
-1
-2
Pond
-3
-4
-5
Jetty Tip
-6
2000
0
500
1000
1500
Distance Across Inlet and Pond, ft
Figure 3-45. Goldsmith Inlet channel center line elevation, 8 October 2002
Water level
The locations of the tide gauge and the current meter are indicated in Figure 3-46.
Tide Gauge 3 was placed near the southern bank of Goldsmith Pond and secured to the
pond bottom by rebar, because there were no structures available to serve as a mounting
platform. Water level at Goldsmith Pond is plotted in Figure 3-47a, together with that in
Long Island Sound measured at the Mattituck Inlet jetty (Tide Gauge 1). In Goldsmith
Pond, the average water level of the record was 0.91 ft above NAVD88. This means that
the pond does not completely empty to mean sea level, because the water flow is retarded
by the sill in the area of the flood shoal, as indicated in Figure 3-47a and, to a lesser
extent, by the sill near the Long Island Sound shoreline.
The measured tidal range within Goldsmith Pond varied from 1.2 to 3.5 ft NAVD88.
The mean tidal range for the deployment was calculated to be 2.15 ft, with a spring tidal
range of approximately 2.9 ft for the period of record. With the measured tidal range
offshore of Mattituck Inlet as an accurate representation of the tidal range offshore of
Goldsmith Inlet, the reduction in tide at Goldsmith Pond is about 3 ft or half the tidal
range in Long Island Sound.
88
Chapter 3 Field Data Collection and Analysis


 Previous Page
