

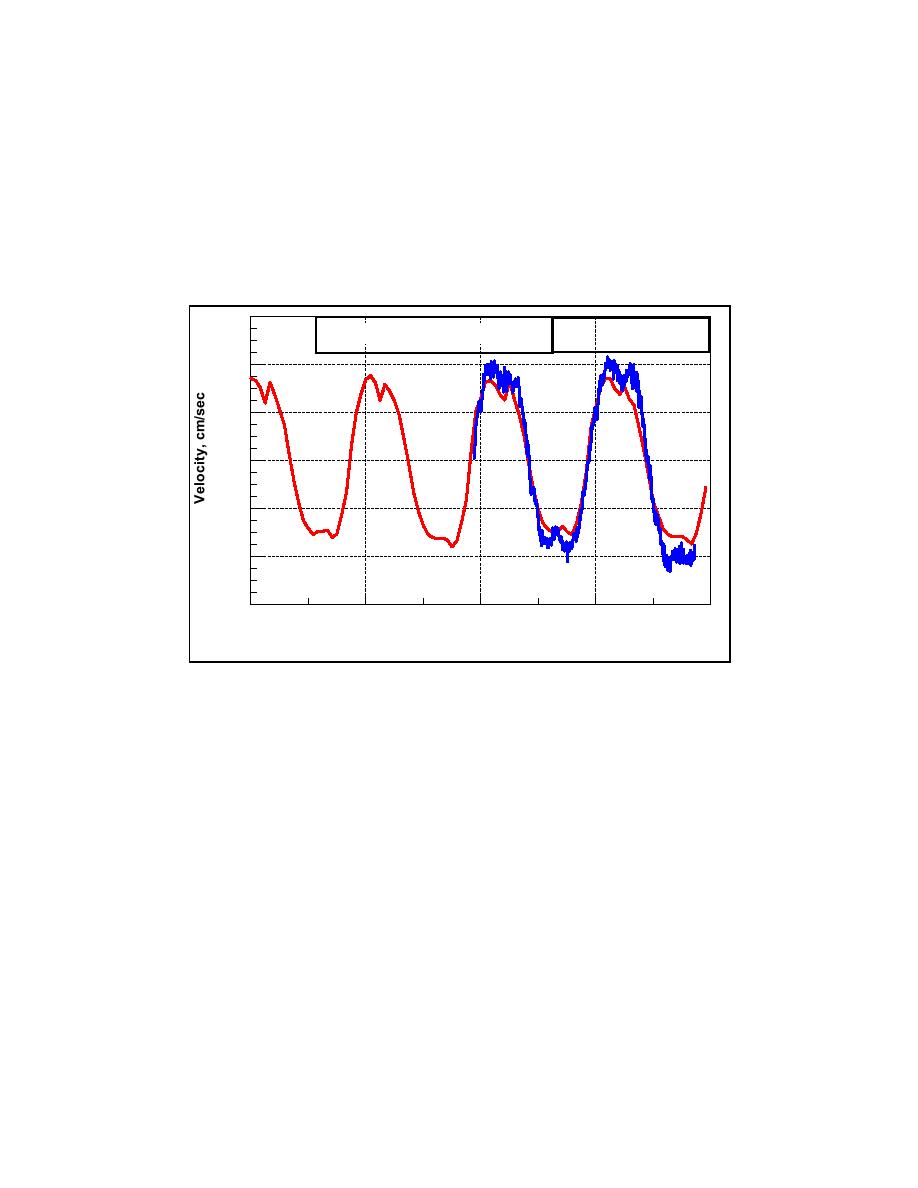
Figure 5-7 plots current velocity measurements collected 7-8 October 2002
(Current meter 1) and ADCIRC calculations. The model reproduces both the
amplitude and phase of the current. The calculation exhibits a broad or double-
peaked crest and trough in the current. The measurements contain these features,
somewhat obscured by noise in the signal. The deviation from a sine curve is
caused by nonlinearity in the tidal wave as it shoals into shallow water from
Long Island Sound.
60
________ Measurements
Mattituck Creek Current Velocity
________
ADCIRC Calculations
40
20
0
-20
-40
-60
7.00
7.50
8.00
8.50
9.00
7-8 October 2002
Figure 5-7.
Current velocity at Mattituck Creek; measurements and ADCIRC
calculations, 7-8 October 2002
Pre-dredging condition (2002)
Calculated current velocities, based on the bathymetric survey data of
6-8 October 2002, are presented here. Calculated velocities offshore of
Mattituck Inlet range from 0 to 0.6 m/sec, and calculated velocities within
Mattituck Inlet range from 0 to 0.5 m/sec. Near-maximum calculated flood and
ebb current velocities for the offshore study area are shown in Figures 5-8a and
5-8b, respectively. These figures plot the calculated near-maximum flood and
ebb tide velocities during a period of spring tide, at approximately 1200 and 1830
GMT on 7 October 2002, respectively. The velocities are termed near-maximum
in that the time of maximum was sought for the area around the inlet, which may
not be the maximum in the channel or in the nearshore.
213
Chapter 5 Circulation Analysis

 Previous Page
