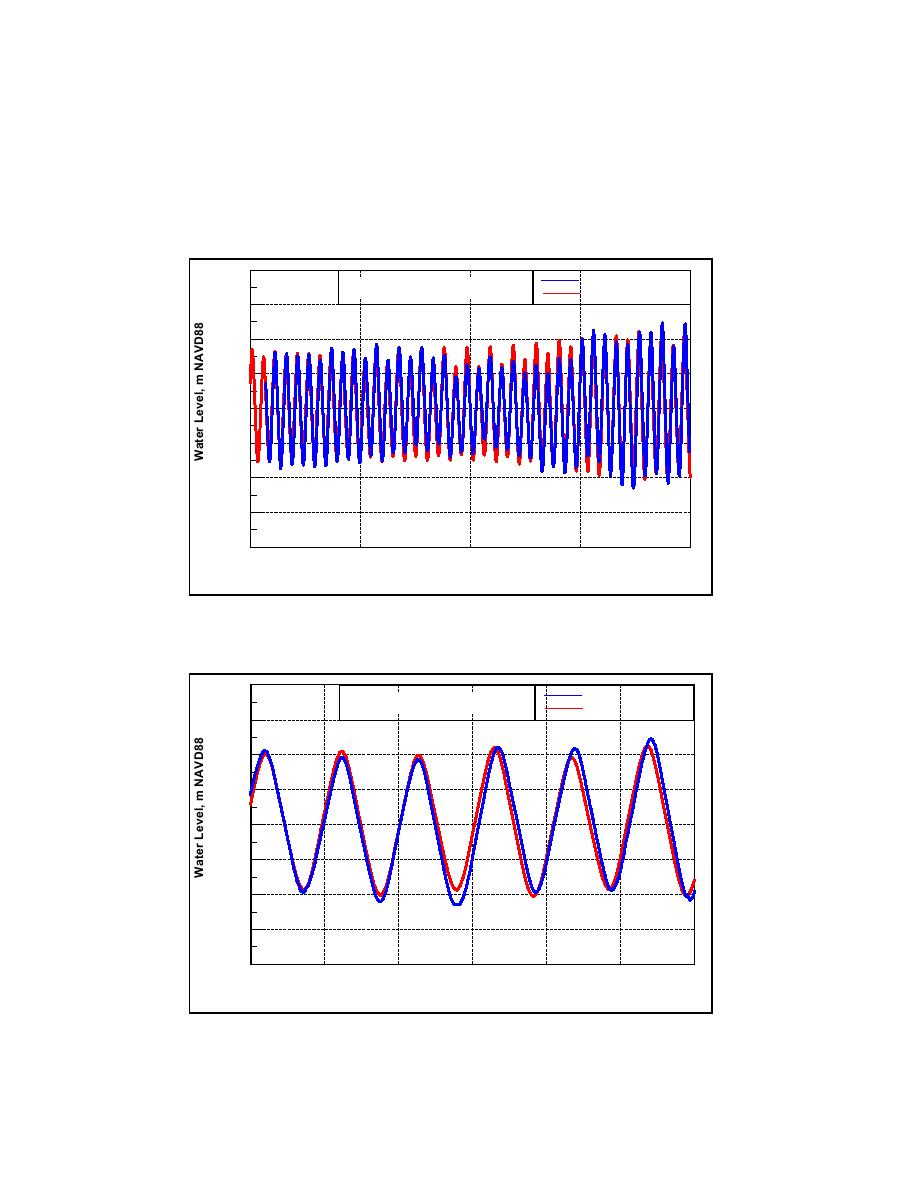
Local validation. ADCIRC calculations of water level were compared to
measurements made at Mattituck Inlet and Mattituck Creek from 19 September
to 8 October 2002 (Figures 5-6a through 5-6d). The locations of the tide gauges
for this survey are given in Figure 3-23. Both amplitude and phase of the
measurements are reproduced. The tidal signal maintains amplitude or increases
in amplitude at the creek station because of the constricted flow there.
2.0
Measurements
Mattituck Inlet Water Level
ADCIRC Calculations
1.5
1.0
0.5
0.0
-0.5
-1.0
-1.5
-2.0
10/9
10/4
9/24
9/19
9/29
September 2002 - October 2002 GMT
Figure 5-6a.
Water level at Mattituck Inlet, near west jetty; measurements and
ADCIRC calculations, 19 September - 8 October 2002
2.0
Measurements
Mattituck Inlet Water Level
ADCIRC Calculations
1.5
1.0
0.5
0.0
-0.5
-1.0
-1.5
-2.0
10/6
10/5
10/7
10/8
5-7 October 2002 GMT
Figure 5-6b.
Water level at Mattituck Inlet, near west jetty; measurements and
ADCIRC calculations, 5-8 October 2002
211
Chapter 5 Circulation Analysis


 Previous Page
