

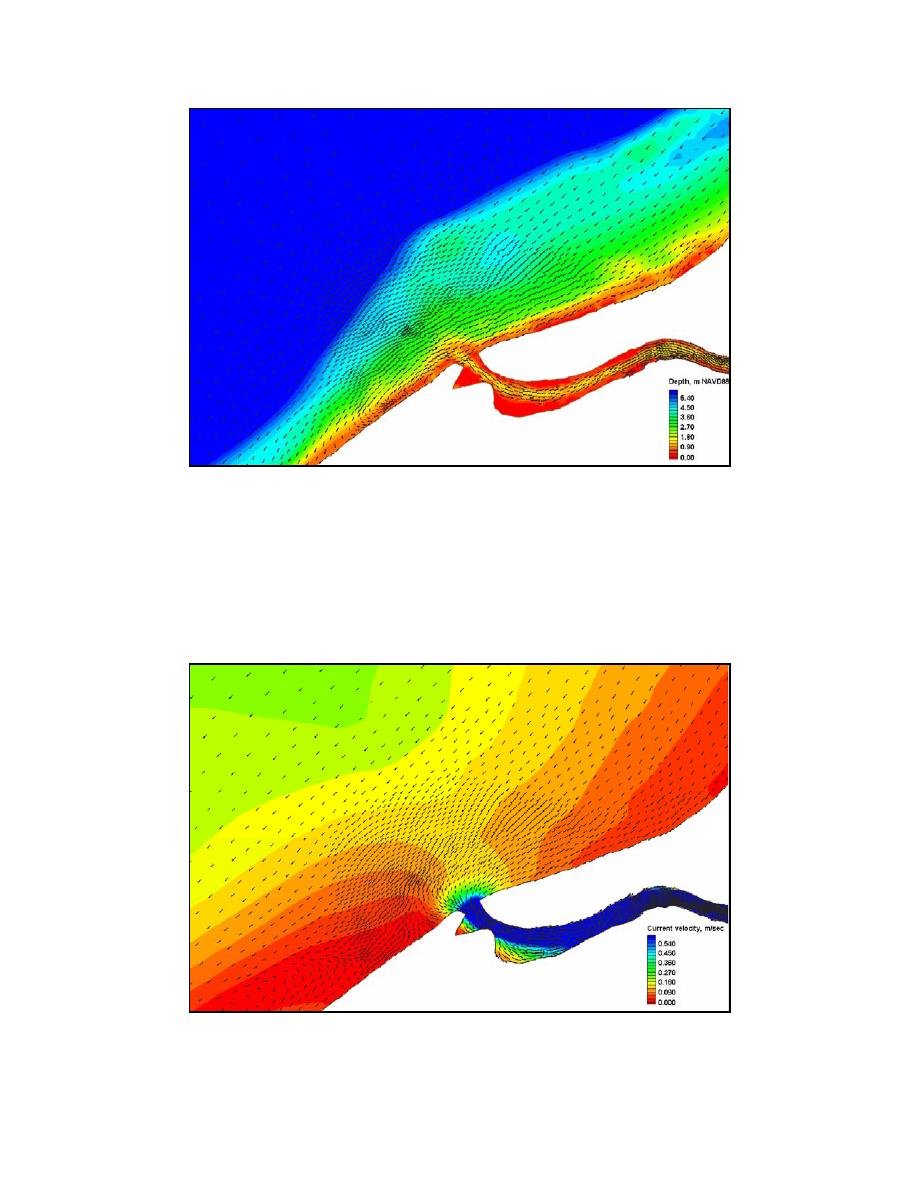
Figure 5-18b. Near-maximum offshore flood-tide velocity and depth, Mattituck
Inlet offshore shoal area, 1200 GMT on 7 October 2002
Figure 5-18c illustrates current velocity at 1430 on 7 October 2002, the time
of near-maximum inlet flood current. Figures 5-18d displays the same current
velocity vectors overlying the inlet and offshore shoal bathymetry.
Figure 5-18c. Near-maximum inlet flood-tide velocity, Mattituck Inlet offshore
shoal area, 1430 GMT on 7 October 2002
238
Chapter 5 Circulation Analysis

 Previous Page
