

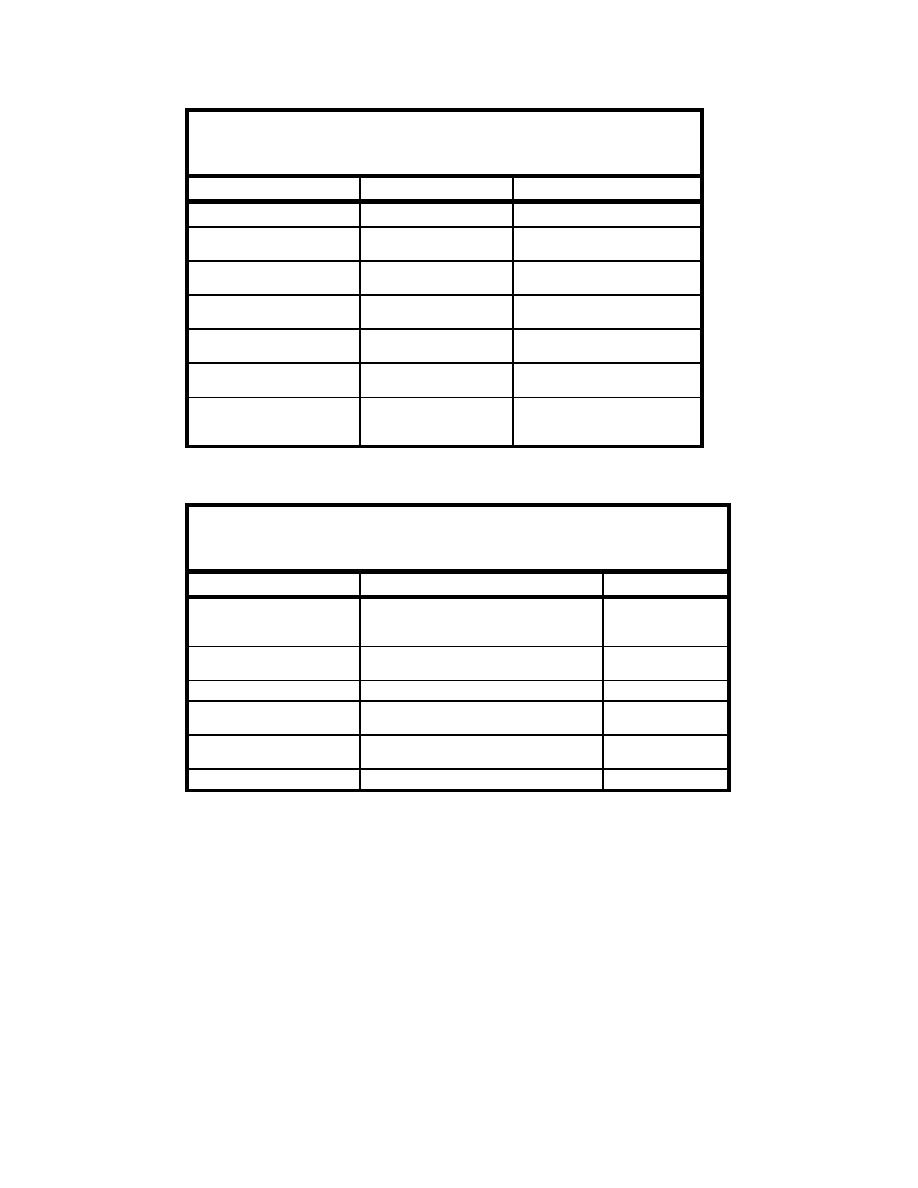
Table 7-3
Mattituck Inlet and Goldsmith Inlet - Hydrodynamic
Characteristics
Characteristic
Mattituck Inlet
Goldsmith Inlet
7
6
Tidal prism (cu ft)
4.32 x 10
3.04 x 10
Mean tide range (in creek and
pond) (ft)
5.26
2.15
Spring tide range (in creek and
6
2.9
pond) (ft)
Average ebb tide duration
(min)
373
536
Average flood tide duration
370
208
(min)
Maximum observed tidal
current (m/sec)
0.4 - 0.5
1.3 and rising
Maximum calculated tidal
current in inlet entrance
(m/sec)
0.47
1.43
Table 7-4
Mattituck Inlet and Goldsmith Inlet, Summary of Key Engineering
Activities
Activity
Mattituck Inlet
Goldsmith Inlet
1906 - 1914 (intermittent)
1937 - 1938 (west jetty seaward extension)
Jetty construction dates
1963 - 1964
1946 (east jetty landward extension)
1,020 - east jetty
Jetty length (ft)
1,320 - west jetty
350-400
Width between jetties (ft)
400
NA
Average volumes dredged
38,000 (1921 - 1965)
4,700
(cu yd)
17,000 (1980 - 2004)
Typical interval between
4.9 (1921 - 1965)
dredging (years)
13 (1980 - 2004
1 - 1.5
Dredging depth (ft) mlw
7 plus 2
3
Comparative Analysis
This section gives an integrated comparative analysis of Mattituck Inlet and
Goldsmith Inlet. Tables 7-1 to 7-4 can be consulted for additional or related
information.
Forcing
Mattituck Inlet and Goldsmith Inlet experience almost the same tidal forcing,
incident waves, wind, storms, and longshore sediment transport potential by
waves. The average and spring tidal ranges in eastern Long Island Sound near
288
Chapter 7 Comparative Analysis and Conclusions

 Previous Page
