1.2
Variable Kt
1.1
Constant Kt
1.0
0.9
0.8
0.7
0.6
0
1
2
3
4
5
6
Wave Height (m)
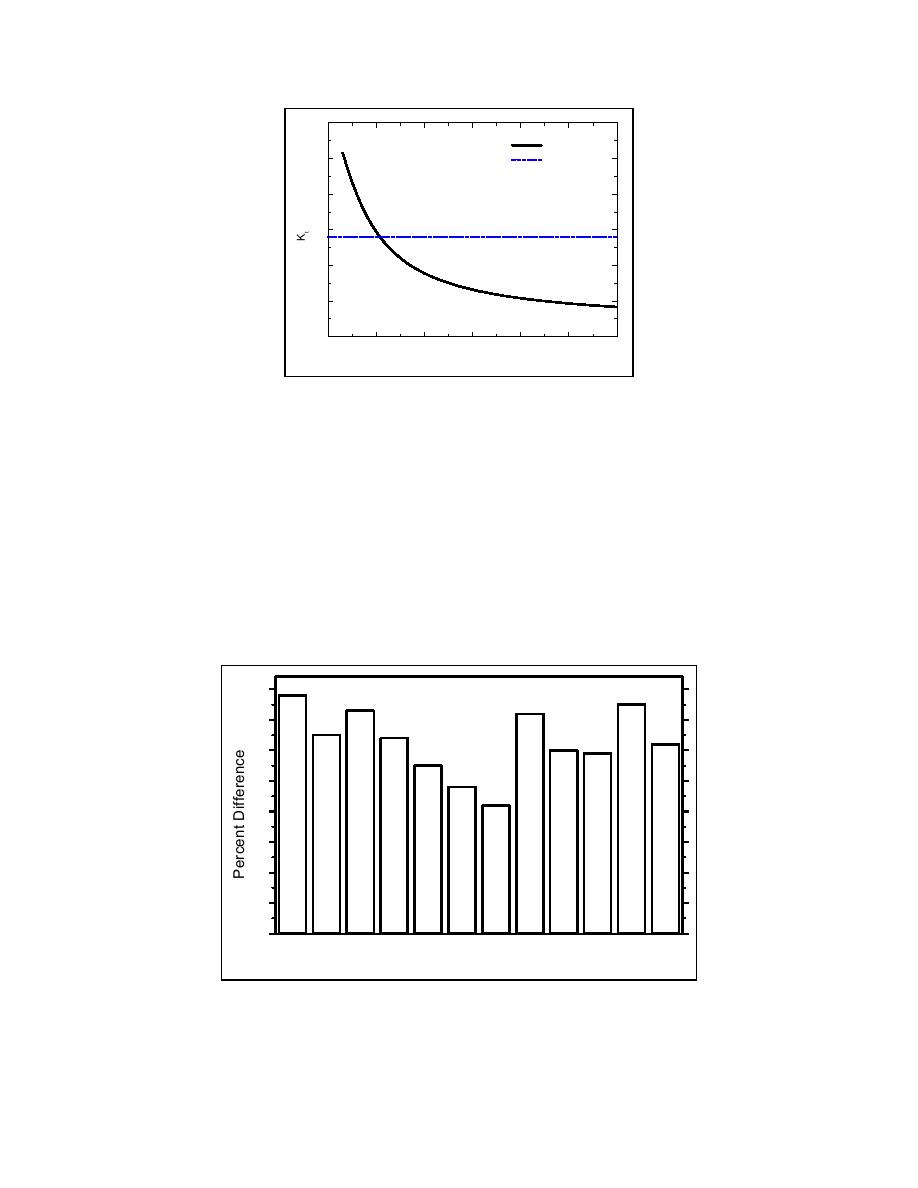
Fig. 2. Change in Kt versus wave height at a constant water level for a
submerged structure
The shoreline change as illustrated in Figure 1 and the difference between the constant and
variable Kt simulations represents the change at a particular moment in time. To assess the role of
variable wave transmission in simulations, the relative difference must be examined over time.
Figure 3 plots the percent difference between the constant and variable Kt simulation predictions of
shoreline change for the Atlantic wave climate by month for a 1-year interval. The application of
the variable Kt results in a 40-80% difference in the predicted average shoreline change behind the
structure. A similar difference in shoreline response to a structure with constant and variable wave
transmission was found for the Gulf of Mexico wave climate.
80
70
60
50
40
30
20
10
0
Nov Dec
F2 b Mar
e
Apr May Jun
J7 l
u
Jan
Aug S9 p Oct
e
1
3
4
5
6
8
10
11
12
Month
Fig. 3. Percent difference in shoreline change behind submerged structure between constant and time-
dependent Kt calculation methods, by month
Wamsley et al
4


 Previous Page
