

sediment. Coastal structures and beach fill can be introduced in almost arbitrary
numbers, locations, and combinations. Other processes included are wave
transmission through structures, sediment passing through or by groins and jetties,
wave diffraction from multiple structures and headlands, and multiple wave trains
(e.g. wind waves and swell from different directions). However, the original
GENESIS model also has limitations, of which a significant one is the lack of
capability to represent tombolos. The present paper discusses preliminary results
of recent enhancements of the GENESIS model regarding an algorithm for
representing tombolos inside of T-head groins and detached breakwaters.
PROCEDURE
Representation of Tombolos. The boundary condition for representing tombolo
formation at T-head groins and detached breakwaters (DBWs) is formulated
analogously to that of a seawall in GENESIS as discussed in Hanson and Kraus
(1986) and in Kraus and Hanson (1995). However, implementation of the
tombolo constraint is more complex as it includes wave diffraction, blocking of
previously open calculation cells, and transport of sediment on both the landward
and the seaward sides of the structure. The tombolo concept implies that the
beach can reach the structure but not further. As a calculation cell makes contact
with the structure, the transport rate into that cell is adjusted to allow the excess
sediment to remain in updrift cells. The procedure to do this must conserve
sediment volume and preserve the direction of its transport.
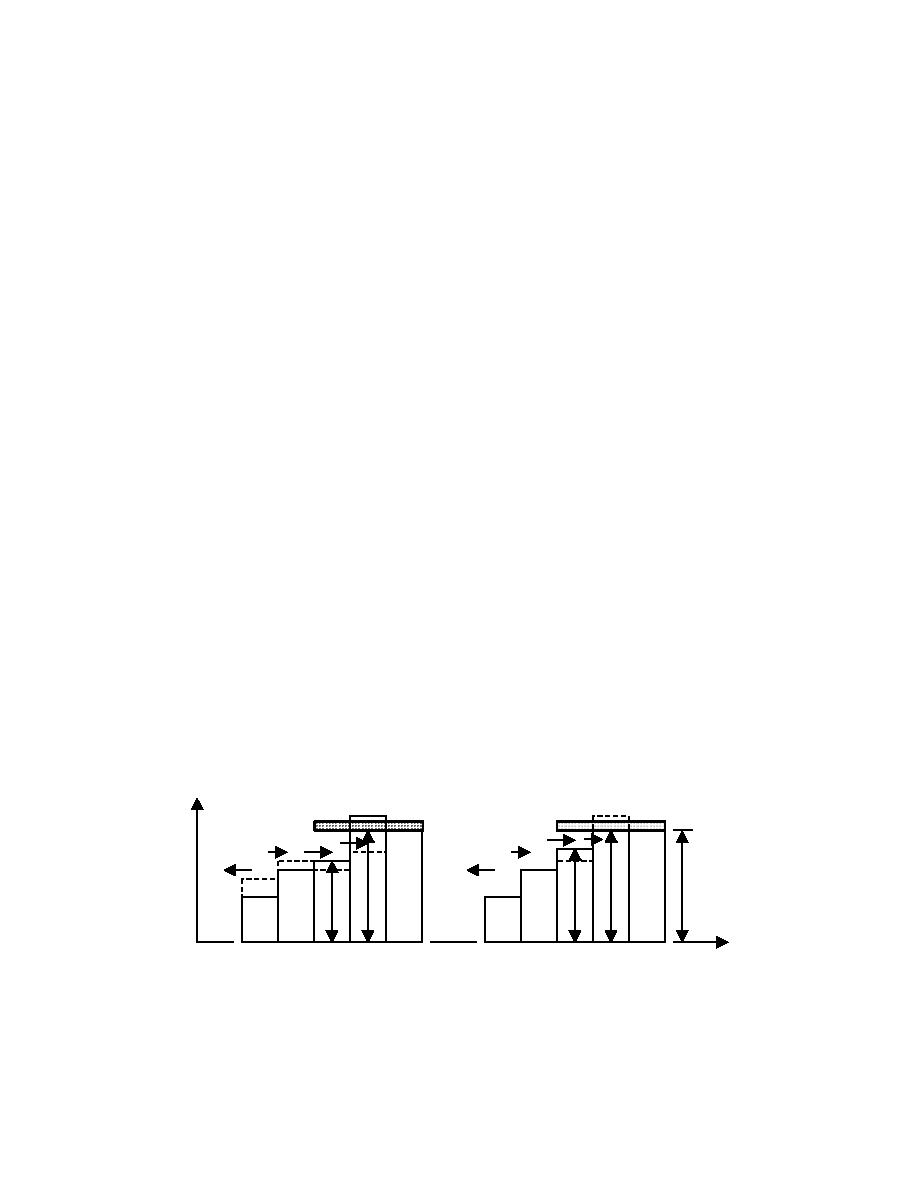
The procedure is illustrated in Fig. 1, a plan view of an idealized beach
protected by a DBW at an arbitrary moment in time. In the figure, the x-axis runs
along the main trend of the shoreline, and the shoreline location y is represented
by the length of each cell. Shoreline change at each cell is determined by the net
flux of sediment over its two shore-perpendicular walls. A net influx (gain)
produces beach accretion and a net outflux (loss) produces erosion. A tombolo
has developed in Cell 7 in a previous time step. In the adjacent Cell 6, allowing
the calculated influx Q6 from Cell 5 to enter, the shoreline would advance beyond
the DBW (Fig. 1a), which is not allowed.
y
*
Q*
Q5
Q6
Q5
6
y*
y*
y5
y6
yt
5
6
x
3
4
5
6
7
3
4
5
6
7
(a)
(b)
Fig. 1. Schematic plan view illustrating (a) initially calculated transport rates and
shoreline location and (b) corrections near tombolo formation.
2

 Previous Page
