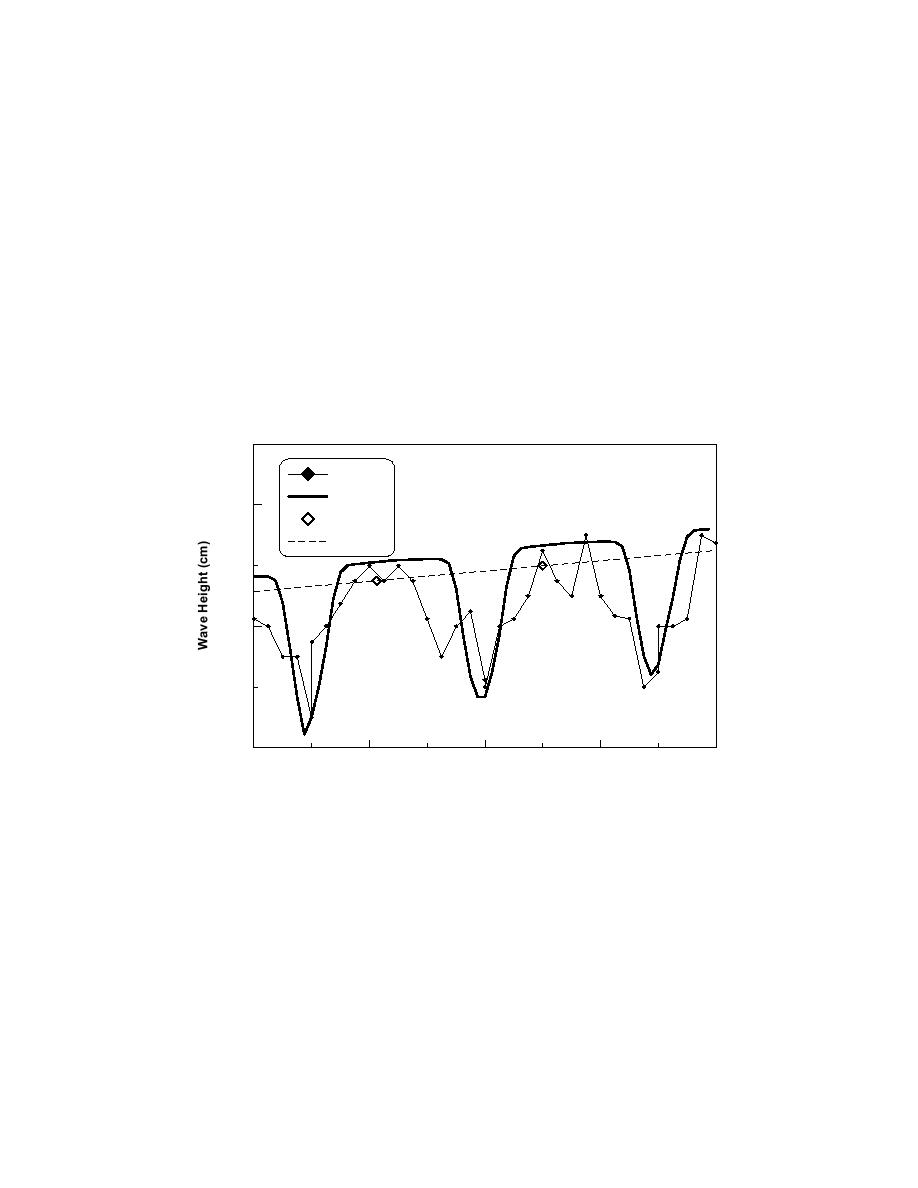
Results for Case 4 are shown in Fig. 4 where the measured and interpolated
offshore wave heights are also displayed.
There is good overall agreement between measured and calculated breaking
wave height, especially in the gap between structures. Model validation for this
case is shown in Fig. 5 for which shoreline positions at 1 and 18 hr were used.
The left-hand salient (A) is well predicted, whereas the other two salients (B and
C) are somewhat over-predicted.
Some of the discrepancy in shoreline position is attributed to uncontrollable
problems in the physical model, such as slumping of the beach and presence of a
basin circulation. Also, rip currents expected to appear in the physical model and
in the field are not represented in GENESIS. Thus, both types of models have
limitations. As a whole, replication of the physical model behavior is considered
good.
Hb meas
Hb calc
8.0
Ho meas
Ho input
4.0
0.0
0
4
8
12
16
Distance Alongshore (m)
Fig. 4. Alongshore distribution of wave height for Case 4.
6


 Previous Page
